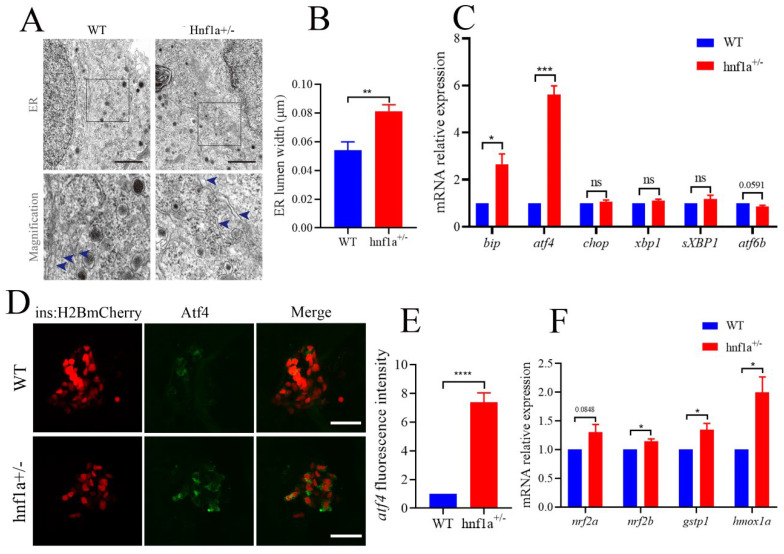
IMAGE

Figure 3

ID
ZDB-IMAGE-221118-150
Source
Figures for Chen et al., 2022
Image
Figure Caption

Figure 3

The β cells of hnf1a+/− zebrafish displayed ER stress. (A) Transmission electron microscopy analysis of ER in WT and hnf1a+/− β cells at 6 dpf zebrafish. Blue arrows indicated magnified ER morphology. Scale bar: 3 μm. (B) Quantification of ER lumen width for WT and hnf1a+/− β cells. At least 15 different locations of the same cell were measured; n = 3 β cells for each genotype. (C) RT-qPCR analysis of the mRNA expression levels for ER-stress-related marker genes in WT and hnf1a+/− larvae at 6 dpf: bip, atf4, chop, xbp1, sXBP1, and atf6b. (D) Immunofluorescence analysis of WT and hnf1a+/− larvae at 6 dpf with atf4 staining (Green). β cells are indicated by the red fluorescence with Tg(ins:H2BmCherry). Scale bar indicates 20 μm. (E). Quantification of fluorescence intensity for atf4 in WT and hnf1a+/−; n = 3 larvae for each genotype. (F) RT-qPCR analysis of the mRNA expression levels for nrf2a, nrf2b, gstp1, and hmoxla in WT and hnf1a+/− larvae; n = 3 larvae for each genotype. Results are represented as means with standard errors; * p < 0.05, ** p < 0.01, and *** p < 0.001, and **** p < 0.0001. Student’s t-test. All experiments were performed in at least three biological repeats. WT, wild type.

Acknowledgments
This image is the copyrighted work of the attributed author or publisher, and ZFIN has permission only to display this image to its users. Additional permissions should be obtained from the applicable author or publisher of the image. Full text @ Int. J. Mol. Sci.