
- Title
-
wnt16 regulates spine and muscle morphogenesis through parallel signals from notochord and dermomyotome
- Authors
- Watson, C.J., Tang, W.J., Rojas, M.F., Fiedler, I.A.K., Morfin Montes de Oca, E., Cronrath, A.R., Callies, L.K., Swearer, A.A., Ahmed, A.R., Sethuraman, V., Addish, S., Farr, G.H., Gómez, A.E., Rai, J., Monstad-Rios, A.T., Gardiner, E.M., Karasik, D., Maves, L., Busse, B., Hsu, Y.H., Kwon, R.Y.
- Source
- Full text @ PLoS Genet.
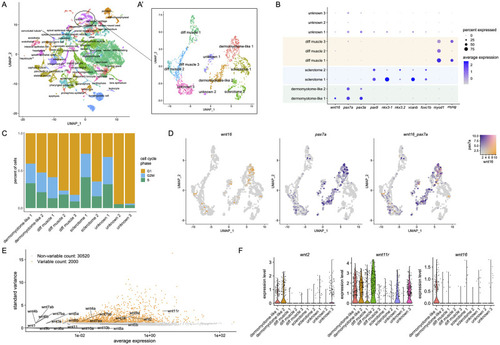
Single-cell transcriptional profiling of somitic wnt16+ cells.
(A) UMAP plot visualizing cell clusters from the sci-RNA-seq analysis of zebrafish embryonic development, as performed by Farnsworth et al., Dev Biol 2020 459:100–108. Circle shows somite cluster used for analysis in this study. (A’) Subclustering of the somite cluster. Of the 10 distinct clusters, 7 could be identified by molecular markers, including two dermomyotome-like populations. (B) Dotplot visualizing expression of genes demarcating the 12 cell clusters. Circle size represents the percentage of cells expressing the gene, and color indicates average gene expression. (C) Percentage of cells in each cell cycle phase. (D) Blend plots for wnt16 and pax7a. (E) Variable features plot for all zebrafish wnt family members. Note that wnt11 (wnt11f1) and wnt11f2 are annotated in the atlas as wnt11r and wnt11, respectively. (F) Violin plots for wnt2, wnt11 (annotated in the atlas as wnt11r), and wnt16. |
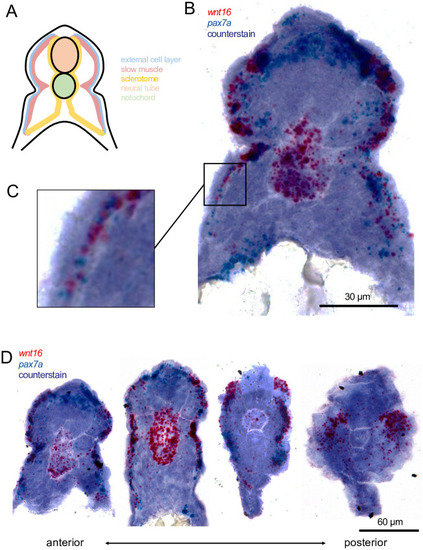
wnt16 is expressed in dermomyotome-like cells at 22 hpf.
(A) A schematic of a transverse section through the zebrafish trunk with compartments labeled and color coded. (B-C) Chromogenic in situ hybridization of an anterior (note the yolk in the ventral space) transverse section through the zebrafish trunk shows cells expressing wnt16 and pax7a are located in the external cell layer (magnified in C). (D) Transverse sections, beginning in the anterior trunk (left), and moving posteriorly (right), representing less mature somites, show variation in wnt16+ labeling. |
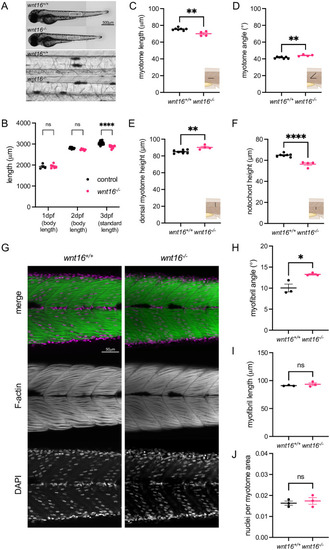
wnt16 is required for notochord and myotome morphogenesis.
(A) Brightfield images of wnt16-/- mutants and clutchmate controls. Insets show closeup of notochord. (B) wnt16-/- mutants exhibit significantly reduced standard length at 3 dpf. (C-F) Myotome morphology (C-E) and notochord height (F) are altered in wnt16-/- mutants. Insets provide schematic of measurement. (G) Lateral views of phalloidin-stained 3dpf animals obtained using confocal microscopy. (H-I) Quantitative image analysis reveals that myofibril angle (H) but not myofibril length (I) or nuclei per myotome area (J) are altered in wnt16-/- mutants. P-values were determined using either two-way ANOVA with Fisher’s LSD post hoc test (B) or an unpaired t-test (C-F, H-J). *p<0.05, **p<0.01, ****p<0.0001, ns: not significant. |
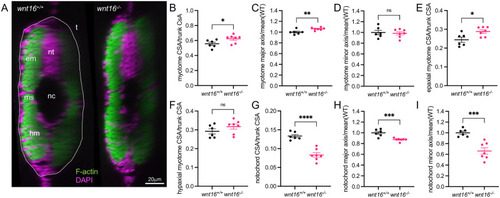
wnt16 suppresses myotome expansion and promotes notochord radial expansion.
(A) Transverse views of phalloidin-stained 3dpf animals. em: epaxial myotome, hm: hypaxial myotome, ms: myosepta, nc: notochord, nt: neural tube, t: trunk. (B-I) Quantification of myotome (B-F) and notochord (G-I) morphology. P-values were determined using an unpaired t-test. *p<0.05, **p<0.01, ***p<0.001, ****p<0.0001, ns: not significant. |
wnt16 is expressed in the ventral midline of the notochord sheath.
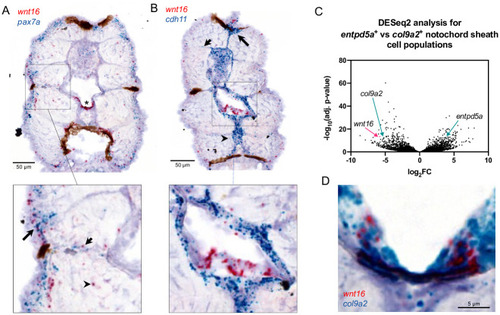
(A, B) Chromogenic in situ hybridization was performed in transverse sections through the zebrafish trunk at 12 dpf. (A) Co-staining for wnt16 and pax7. Staining for wnt16 was detected in notochord (star) and was mostly negative for pax7a. Staining for wnt16 was also detected in cells in the lateral portion of the myotome (inset, long arrow), within or adjacent to presumptive myosepta (inset, short arrow), and sporadically within the myotome (inset, arrowhead). (B) Co-staining for wnt16 and cdh11. Staining for cdh11 was apparent in cells surrounding the notochord, the dorsal myotome (long arrow), presumptive myosepta (short arrow), and the medial portion of the ventral myotome (arrowhead). With regard to notochord, staining for wnt16 was localized within a single layer of cells surrounded by cells staining positively for cdh11 (inset). (C) Analysis of RNA-seq data from [18] shows that wnt16 is differentially expressed in col9a2+ relative to entpd5a+ sheath cells. (D) Co-staining for wnt16 and col9a2 shows co-localization at the ventral midline of the notochord sheath. |
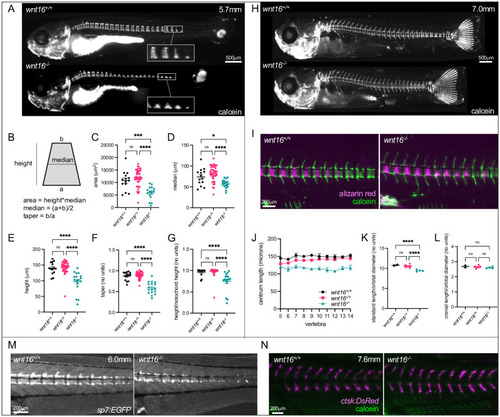
wnt16 is necessary for notochord sheath mineralization.
(A) Calcein staining in wnt16-/- larvae (WT: 5.7mm SL). In wnt16-/- mutants, mineralized domains are irregular in shape, incompletely proceeding to the dorsal surface from the ventral surface of the notochord. (B-G) Quantification of mineralizing domain morphology. In (C-G), each point represents a single fish, with values averaged from vertebrae 1–16. (H) Calcein staining in wnt16-/- larvae (WT: 7.0mm SL). (I) Dual fluorochrome staining shows trapezoid-like mineralized domains in wnt16-/- mutants eventually became rectangle-like. (J-L) Quantification of centrum length (J), standard length (K), and cranial length (L). (M) Visualization of osteoblastic cells using Tg[sp7:EGFP]. EGFP domains in mutants appear trapezoid-like with reduced expression on the dorsal surface, resembling calcein domains in (A). (N) Visualization of osteoclastic cells using Tg[ctsk:DsRed]. Similar DsRed domains are observed in wildtype and wnt16-/- mutants. P-values were determined using one-way ANOVA with Fisher’s LSD post hoc test. *p<0.05, **p<0.01, ***p<0.001, ****p<0.0001, ns: not significant. |
Adult wnt16-/- mutants exhibit reduced centrum length and increased mineralization.
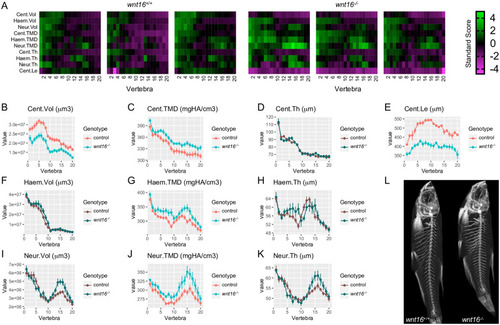
(A) Skeletal barcodes visually depict individual phenomes for wnt16+/+ and wnt16-/- fish (3 fish/group shown). (B–K) Phenotypic features, indicated by the graph title (with units for y axis), are plotted as a function of vertebra along the spine. Control indicates wnt16+/+ or wnt16-/+ clutchmates. Measures with p<0.05 in the global test are in a lighter coloring scheme, n = 6-10/group. Cent, centrum; Haem, haemal arch; Neur, neural arch; Vol, volume; TMD, tissue mineral density; Th, thickness; Le, length. (L) Maximum intensity projections of microCT scans. |
Adult wnt16-/- mutants exhibit altered lean mass and morphology.
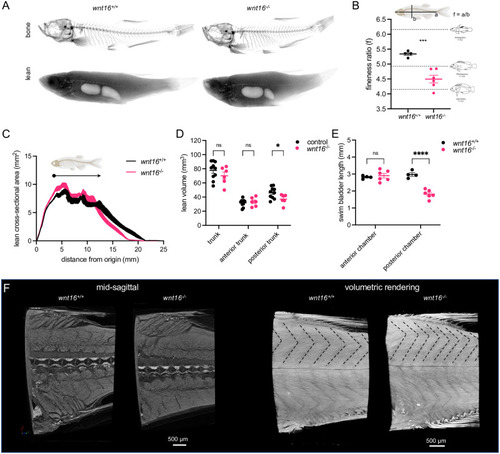
(A) Segmentation of microCT images for bone (top) and lean (bottom) tissue. Shown are average intensity projections. (B) wnt16-/- mutants exhibit reduced fineness ratio. Fish images adapted from [46]. (C) Lean cross-sectional area as a function of distance along the anteroposterior axis. Thickness of the line indicates standard error of the mean (n = 4-6/group). Arrowhead indicates approximate boundary between the anterior and posterior swim bladders. (D) Lean volume in the trunk, anterior trunk, and posterior trunk. wnt16-/- mutants exhibit reduced lean volume in the posterior trunk compared to controls (wnt16+/+ and wnt16+/-) (E) wnt16-/- mutants exhibit reduced swim bladder length in the posterior, but not anterior, chamber compared to wildtype. (F) High-resolution contrast-enhanced microCT reveals altered myomere width and angle in wnt16-/- mutants as indicated by dotted lines in the top part of the myotome compartment in volumetric renderings. P-values were determined using an unpaired t-test (B) or two-way repeated measures ANOVA (D and E) with Fisher’s LSD post hoc test. *p<0.05, ***p<0.001, ****p<0.0001. Fig 8 adapts portions of Fig 1 from the following paper: Walker, J.A., Alfaro, M.E., Noble, M.M., and Fulton, C.J. (2013). Body fineness ratio as a predictor of maximum prolonged-swimming speed in coral reef fish. PLoS One 8, e75422. The paper of Walker et al., which was published in PLoS One, applies the Creative Commons Attribution 4.0 International (CC BY) license (https://journals.plos.org/plosone/s/licenses-and-copyright). |
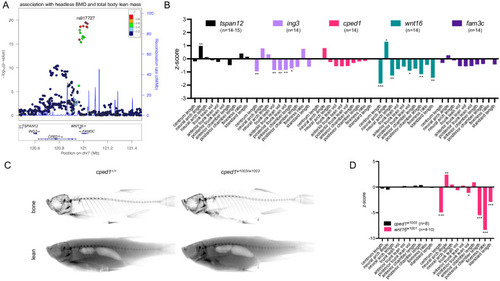
WNT16 is a gene of major effect on lean mass at the CPED1-WNT16 locus.
(A) Schematic depicting variant associations and all genes with transcriptional start sites within ±500kb of the most significantly associated SNP at 7q31.31. (B) Z-scores for somatic mutants for tspan12, ing3, cped1, wnt16, and fam3c. (C) Segmentation of microCT images for cped1w1003 mutants for bone (top) and lean (bottom) tissue. (D) Z-scores for cped1w1003 and wnt16w1001 mutants. P-values were determined using an unpaired t-test with the number of fish per group provided in the figure. *p<0.05, **p<0.01, ***p<0.001. |