
Image
|
Figure Caption
Fig 9
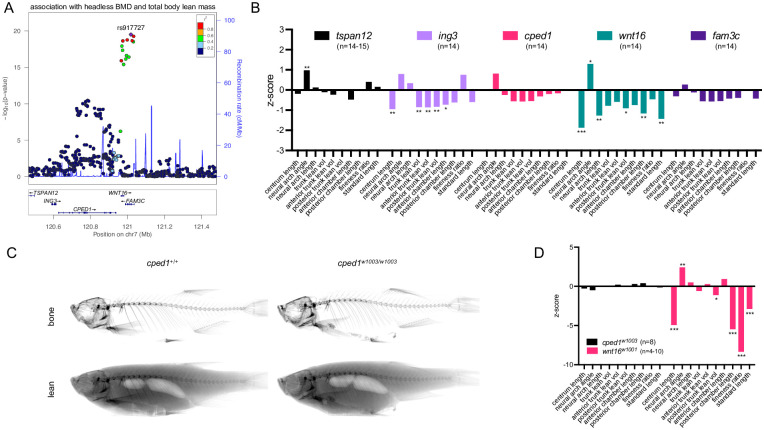
WNT16 is a gene of major effect on lean mass at the CPED1-WNT16 locus.
(A) Schematic depicting variant associations and all genes with transcriptional start sites within ±500kb of the most significantly associated SNP at 7q31.31. (B) Z-scores for somatic mutants for tspan12, ing3, cped1, wnt16, and fam3c. (C) Segmentation of microCT images for cped1w1003 mutants for bone (top) and lean (bottom) tissue. (D) Z-scores for cped1w1003 and wnt16w1001 mutants. P-values were determined using an unpaired t-test with the number of fish per group provided in the figure. *p<0.05, **p<0.01, ***p<0.001.
Acknowledgments
This image is the copyrighted work of the attributed author or publisher, and
ZFIN has permission only to display this image to its users.
Additional permissions should be obtained from the applicable author or publisher of the image.
Full text @ PLoS Genet.