
- Title
-
Dusp6 deficiency attenuates neutrophil-mediated cardiac damage in the acute inflammatory phase of myocardial infarction
- Authors
- Zhou, X., Zhang, C., Wu, X., Hu, X., Zhang, Y., Wang, X., Zheng, L., Gao, P., Du, J., Zheng, W., Shang, H., Hu, K., Jiang, Z., Nie, Y., Hu, S., Xiao, R.P., Zhu, X., Xiong, J.W.
- Source
- Full text @ Nat. Commun.
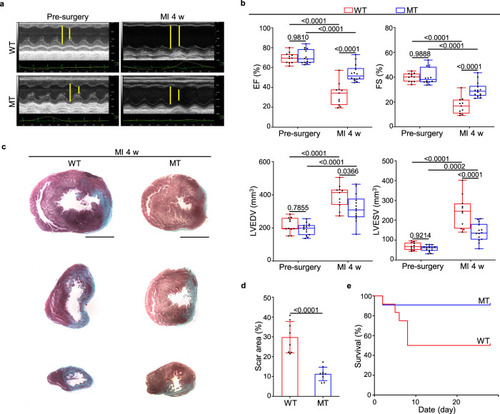
a Representative echocardiographic images from WT (n = 11) and Dusp6-deficient rats (n = 14) before surgery and 4 weeks (4 w) after myocardial infarction (MI). b Measurement of cardiac function indexes EF and FS as well as the left ventricular dilatation indexes LVEDV and LVESV from echocardiographic results as in a. The box blots show center lines as median, box boundaries as upper and lower quartiles, and whiskers as minimum and maximum values. Masson staining of heart sections (c) and quantitative analysis (d) of the fibrotic area from WT (n = 8) and Dusp6-deficient hearts (n = 8) at 4w after MI. Scale bars: 5 mm. e Kaplan–Meier survival curves of WT (n = 11) and Dusp6-deficient rats (n = 12) at 4w after MI. Quantitative data are presented as min to max with all points mean in b, and as values ± SD in d and e. One-way ANOVA with Tukey’s multiple comparison test (for b) and Two-sided unpaired T-test (for d) were used to calculate the presented p-values. Source data of b, d and e are provided in a Source Data File. MI myocardial infarction, WT wild-type, MT Dusp6 mutant, EF ejection fraction, FS fractional shortening, LVEDV left ventricular end-diastolic volume, LVESV left ventricular end-systolic volume. |

a–f Representative TTC-Evans blue staining (a and d) and measurements of infarct size in WT and Dusp6-deficient hearts at 24 h (b and c) and 72 h (e and f) after MI (n = 6 hearts/group). In the ischemic area, the infarcted region is stained white and viable cardiac tissue is stained red. Non-ischemic heart muscle is stained blue (scale bar, 5 mm). Representative TUNEL staining of WT and Dusp6 mutant hearts in sham-operated, MI 6 h, MI 24 h, and MI 72 h (g), and quantitative analysis (h) of cardiomyocyte (CM) cell death in WT and Dusp6-deficient LV tissue. Immunostaining of cTnT was used to co-stain myocardial tissue (n = 9 areas from 3 sham WT hearts and 9 areas from 3 sham MT hearts, 14 areas from WT hearts and 11 areas from MT hearts at 6 h after MI, 17 areas from WT hearts and 17 areas from MT hearts at 24 h after MI, 12 areas from WT hearts and 9 areas from MT hearts at 72 h after MI; scale bar, 100 μm). i Western blot and corresponding quantitative analysis of BAX and BCL-2 from WT and Dusp6-deficient LV tissue at 72 h after MI (n = 6 biological independent samples/group). Coomassie blue staining was used to normalize protein loading. All blots and stainings were performed in parallel with the same samples. j Masson staining and quantitative analysis of interstitial fibrosis in the infarct border zone of WT and Dusp6-deficient hearts at 7 days after MI (n = 9 areas from WT hearts and 9 areas from MT hearts; scale bar, 100 μm). All quantitative data shown in this figure are presented as mean values ± SD. One-way ANOVA with Tukey’s multiple comparison test (for h) and Two-sided unpaired T-test (for b, c, e, f, i and j) were used to calculate the presented p-values. Source data of b, c, e, f, h, i and j are provided in a Source Data File. WT wild-type, MT Dusp6 mutant, TTC triphenyl tetrazolium chloride, IR infarcted region, AAR area at risk, LV left ventricle, BZ infarct border zone, cTnT cardiac troponin T. |

a, b Intracellular staining, flow cytometry and corresponding quantitative analysis of DUSP6 levels in various cell types in wild-type LV tissue at 72 h after MI. n = 5 (CMs, SMCs & Fibroblasts) or 6 (VECs, Neutrophils, Macrophages) biological independent samples/group. Gating strategies for each cell population are shown in Supplementary Fig. 4a. c Representative immunohistochemistry of DUSP6 (dark brown) in wild-type LV tissue at sham operation, 24 h, 72 h, and 7 days after MI (n = 9 areas from 3 hearts/group; scale bar, 100 μm). d–f Representative double immunofluorescence of DUSP6 with either HIS48, MPO, or PR3 in wild-type LV tissue at 72 h after MI, showing DUSP6 expression in neutrophils (n = 9 areas from 3 hearts/group; scale bar, 10 μm). DAPI co-staining was used to display nuclear morphology. All quantitative data shown in this figure are presented as mean values ± SD. One-way ANOVA with Tukey’s multiple comparison test was used to calculate the presented p-values. Source data of b are provided in a Source Data File. CMs cardiomyocytes, VECs vascular endothelial cells, SMCs smooth muscle cells, MPO myeloperoxidase, PR3 proteinase 3, MFI median fluorescence intensity. |

a Representative Giemsa staining of PMNs and PBMCs separated from PBLs by density-gradient centrifugation and erythrocyte lysis (scale bar, 50 μm). b Quantitative RT-PCR of Dusp6 mRNA in PMNs and PBMCs from WT rats for sham-operated, MI 6 h, MI 24 h, and MI 72 h (performed in duplicates with n = 3 biological independent samples/group). c, d Western blot and corresponding quantitative analysis of DUSP6 in WT PMNs and PBMCs for sham-operated, MI 6 h, MI 24 h, and MI 72 h (n = 6 biological independent samples/group). GAPDH was used as an internal control. All blots within each individual panel were performed in parallel with the same samples. e Intracellular staining, flow cytometry and corresponding quantitative analysis of DUSP6 in HIS48+ and HIS48– cells from PBLs of unoperated WT rats (n = 6 biological independent samples/group). All quantitative data shown in this figure are presented as mean values ± SD. Two-sided unpaired T-test was used to calculate the presented p-values. Source data of b–e are provided in a Source Data File. PMNs polymorphonuclear cells (peripheral neutrophils), PBMCs peripheral blood mononuclear cells, PBLs peripheral blood leukocytes, MFI, median fluorescence intensity. |

a Dihydrorhodamine 123 (DHR 123) staining, flow cytometry and corresponding quantitative analysis of ROS levels in WT and Dusp6-deficient PMNs with either PBS or PMA stimulation (n = 3 biological independent samples/group). b ELISA analysis of LTF and MMP9 release in WT and Dusp6-deficient PMNs with either PBS or PMA stimulation (n = 4 biological independent samples/group). c, d DHR 123 staining assays of ROS production (n = 3 biological independent samples/group), and ELISA analysis of LTF and MMP9 release (n = 3 biological independent samples/group) in WT and Dusp6-deficient ABNs. Gating strategies for peripheral and abdominal neutrophils are shown in Supplementary Fig. 4b. e, f Representative immunohistochemistry images and corresponding quantitative analysis of 8-OHdG staining in WT and Dusp6-deficient LV tissue from sham-operated or 72 h after MI (n = 9 areas from 3 hearts/group; scale bar, 100 μm; BZ, infarct border zone). g ELISA analysis of the levels of LTF and MMP9 in WT and Dusp6-deficient LV tissue from sham or 72 h after MI (n = 3 biological independent samples/group). All quantitative data shown in this figure are presented as mean values ± SD. One-way ANOVA with Tukey’s multiple comparison test (for a, b, f and g) and Two-sided unpaired T-test (for c and d) were used to calculate the presented p-values. Source data of a–d, f and g are provided in a Source Data File. WT wild-type, MT Dusp6 mutant, PMA phorbol-12-myristate-13-acetate, DHR 123 dihydrorhodamine 123, LTF lactoferrin, MMP9 matrix metallopeptidase 9, ABNs abdominal neutrophils, 8-OHdG 8-hydroxy-2′-deoxyguanosine. |

a Western blot and corresponding quantitative analysis of Dusp6 in ABNs from control and Dusp6Mrp8-KO mice. Control mice were Mrp8-Cre, and Dusp6Mrp8-KO mice were Mrp8-Cre, Dusp6f/f. β-actin served as internal control (n = 6 biological independent samples/group). Both blots were performed in parallel with the same samples. b Echocardiographic measurements of EF and FS for control (n = 13) and Dusp6Mrp8-KO (n = 11) mice before surgery, as well as 24 h, 7 days and 4 weeks after MI. c Echocardiographic measurements of LVEDV and LVESV for control (n = 13) and Dusp6Mrp8-KO (n = 11) mice before surgery and 4 weeks after MI. The box blots show center lines as median, box boundaries as upper and lower quartiles, and whiskers as minimum and maximum values. d Kaplan–Meier survival curves of control (n = 16) and Dusp6Mrp8-KO mice (n = 12) at 4w after MI. Representative Masson staining of heart sections (e) and quantitative analysis (f) of the fibrotic area from control and Dusp6Mrp8-KO hearts at 4 weeks after MI (n = 8/group. Scale bar, 1 mm). Representative TTC-Evans blue staining (g and i) and measurements of infarct size in control and Dusp6Mrp8-KO hearts at 24 h (h) (control: n = 10; Dusp6Mrp8-KO: n = 8) and 72 h (j) (n = 8/group) after MI. Scale bar, 1 mm. Quantitative data are presented as min to max with all points mean in b and c, and as values ± SD in a, f, h and j. One-way ANOVA with Tukey’s multiple comparison test (for b and c) and Two-sided unpaired T-test (for a, f, h and j) were used to calculate the presented p-values. Source data of a–d, f, h and j are provided in a Source Data File. Ctrl control, EF ejection fraction, FS fractional shortening, LVEDV left ventricular end-diastolic volume, LVESV left ventricular end-systolic volume, TTC triphenyl tetrazolium chloride, IR infarcted region, AAR area at risk, LV left ventricle. |

a Western blot of pERK in WT PMNs in unoperated controls and 6–72 h after MI (n = 6/group). Both blots were performed in parallel with the same samples. b, c Western blot and quantitative analysis of pERK levels in WT and Dusp6-deficient PMNs in unoperated controls and 6–72 h after MI (n = 6/group). d, e Western blot and quantitative analysis of p-p38 and pJNK in PMNs from unoperated WT and Dusp6-deficient rats (n = 6/group). f, g Western blot and quantitative analysis of pERK and p-p38 levels in unoperated WT PMNs treated with either p38 inhibitors (BIRB796 and SB203580) or MEK1/2 inhibitors (SL327 and U0126). DMSO was used as a negative control (n = 4 independent experiments). All blots within each individual panel were performed in parallel with the same samples. All quantitative data shown in this figure are presented as mean values ± SD. One-way ANOVA with Tukey’s multiple comparison test (for c and g) and Two-sided unpaired T-test (for e) were used to calculate the presented p-values. Source data of a–g are provided in a Source Data File. WT wild-type, MT Dusp6 mutant. |

a-c Quantitative RT-PCR (a n = 6 biological independent samples/group), western blot (b) and corresponding quantitative analysis (c n = 4 biological independent samples/group) of Dusp6 mRNA and protein in PMNs isolated from unoperated WT rats and treated with either DMSO, p38 inhibitors (BIRB796 or SB203580), or MEK inhibitors (SL327 or U0126). Both blots were performed in parallel with the same samples. d Representative ChIP assays reveal the interaction between C/EBPβ and the Dusp6 promoter fragment (performed in duplicates using PMNs from 5 normal WT rats each time). Anti-Histone H3 and rabbit IgG were used as positive and negative controls, respectively. e Luciferase reporter activity driven by the Dusp6 promoter with WT sequence (Dusp6-p) or mutations of putative C/EBPβ-binding motifs (mDusp6-p) upon the regulation of C/EBPβ in 293 T cells (performed in duplicates with n = 3/group). The pGL3 empty vector was used as negative control. f Quantitative ChIP assays of C/EBPβ binding to the Dusp6 promoter in WT PMNs treated with either DMSO, p38 inhibitor (BIRB796), or MEK1/2 inhibitor (SL327). 3 replicates were performed with PMNs from at least 5 normal WT rats for each group. All quantitative data shown in this figure are presented as mean values ± SD. One-way ANOVA with Tukey’s multiple comparison test were used to calculate the presented p-values. Source data of a–f are provided in a Source Data File. |