FIGURE SUMMARY
Title

A robot-assisted acoustofluidic end effector

Authors
Durrer, J., Agrawal, P., Ozgul, A., Neuhauss, S.C.F., Nama, N., Ahmed, D.
Source
Full text @ Nat. Commun.

Experimental set-up and working principle of the robot-assisted acoustofluidic end effector (RAEE) device.

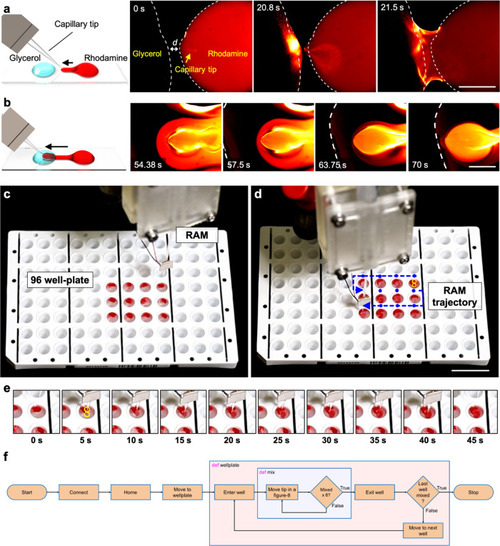
a The RAEE device is comprised of a glass capillary and piezo-electronic transducer connected to a five-axis robotic arm. The whole set-up was mounted on an inverted microscope using a capillary holder. The inset illustrates the overall experimental set-up. b An enlarged view of the RAEE device when submerged in liquid with a focus on streaming profiles, especially the out-of-plane streaming. c The acoustofluidic device generated two distinct flow profiles: (i) circular-flow fields along the shaft of the capillary, and (ii) frequency-dependent 3D streaming at the tip of the glass capillary. d We have applied the RAEE to execute pumping, selective trapping, and viscous mixing.

Characterization of the circular streaming in an acoustofluidic device.

a Randomly distributed tracer microparticles were attracted towards the capillary and exhibit out-of-plane circular streaming along the shaft of the glass capillary in the z-axis. The red arrow depicts the direction of movement of microparticles. See Supplementary Movie 2. Scale bar: 30 µm. b The acoustofluidic device generated a circular-flow field in the liquid surrounding its body, indicated by the PIV-generated velocity fields. The PIV was generated using MATLAB code and the blue arrows represent the velocity and direction of the microparticles. The green dot represents the position of capillary tip. See Supplementary Movie 2. Scale bar: 500 μm. c Average velocities of the tracer particles at the site indicated by the square box in b versus the voltage applied. Particle velocities were proportional to the square of the voltage used, thus satisfying the quadratic relation, as demonstrated in the log plot (inset). d Average velocities of tracer particles versus distance from the capillary boundary. Velocities scale to the power of negative two with distance. Each data point represents the average velocity measured from at least eight tracer particles. Error bars in both graphs c, d represent standard deviation (s.d.) as n ≤ 5. See Supplementary Data Files 2 and 3 for the source data for both graphs.

Frequency-specific vortices or streaming produced by the tip of the acoustofluidic device in water containing tracer particles.

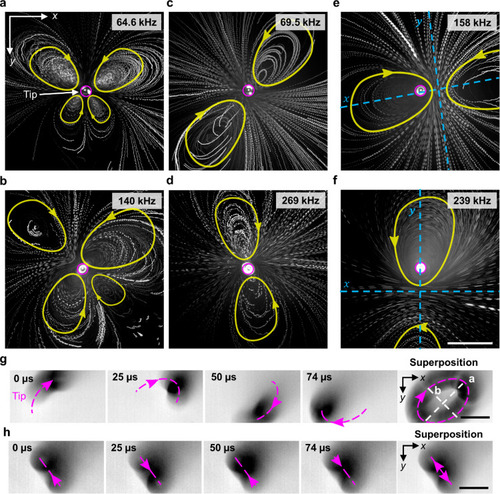
The acoustofluidic device produced steady 3D vortex flow patterns comprised of counter-rotating vortices (The pink circle represents the capillary tip position and yellow geometry represents the direction and path of motion of particles.) (see Supplementary Movie 4): a butterfly-like pattern of four vortices at a 64.6 kHz and b 158 kHz; a pair symmetric about the tip at c 69.5 and d 269 kHz; and a pair ~100 µm off-centre from the tip at e 69.5 kHz and f 269 kHz. The direction of flow is marked with yellow arrows, and the capillary tip indicated by a magenta circle. The symmetry axis is indicated in blue for images where the capillary tip does not represent the centre of symmetry. Dotted magenta lines indicate tip oscillation of the acoustofluidic device (see Supplementary Movie 5), which undergoes g elliptical motion at excitation frequency 6.8 kHz and amplitude 20 VPP and h translational motion at 7.8 kHz and 20 VPP. Scale bars: 50 µm.

Arbitrary controlled motion of the mobile microvortex generator and design of the liquid pump.

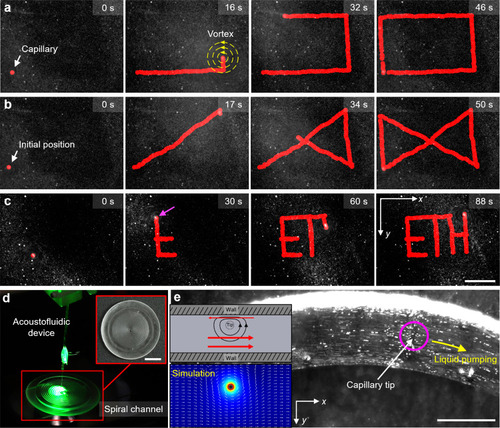
Image sequences depicting the robot-assisted acoustofluidic device executing automated patterns (here the red marking represents the path of the capillary tip and yellow concentric circles represents the vortex generated) (see Supplementary Movie 6): a a rectangle, b an hourglass, and c letters creating the acronym “ETH.” d Photograph showing the RAEE-based microfluidic liquid pump, comprised of an acoustofluidic device and a 3D-printed PDMS-based fluidic channel (see Supplementary Movie 10). d Transformation of the mobile microvortex into a LOC micropump upon immersion of the acoustofluidic device into a 3D-printed spiral fluidic channel. e The vortices produced at an excitation frequency of 134 kHz and amplitude of 10 VPP generated liquid pumping in the left-to-right direction (the magenta circle represents the capillary tip position and yellow arrow represents the liquid pumping direction) (see Supplementary Movie 10). The top inset demonstrates the pumping mechanism (here the red arrow represents the direction of particle motion in that region). The bottom inset illustrates the COMSOL simulation of fluid pumping when the capillary tip was introduced adjacent to the wall. Scale bar ac: 400 µm, scale bar d: 10 mm, scale bar e: 200 µm.

Trapping of a zebrafish embryo using the RAEE.

a Image sequences demonstrating the trapping of a zebrafish embryo (120 hpf) containing an air-filled swim bladder by the acoustofluidic end effector, activated at an excitation frequency of 80 kHz and voltage of 20 VPP (see Supplementary Movie 9) (the green arrow depicts the swim bladder). Scale bar: 200 µm b A magnified micrograph of a trapped zebrafish embryo. Inset: plot of embryo translation velocity versus distance from the capillary tip. Error bar represents that the standard deviation (s.d.) n = 14. See Supplementary Data File 4 for source data for the graph. Scale bar 200 µm.

Pre-programmed high-throughput mixing of viscous fluids in a 96-well plate using the RAEE.

a Conceptual schematic showing the merging of two droplets (left). Image sequences demonstrate the merging of glycerol (black) and rhodamine solution (red) droplets. Dotted white lines indicate droplet contours. Scale bar: 500 µm b Schematic showing the mobile mixing of rhodamine and glycerol droplets. MAEE was utilized to achieve mobile mixing of rhodamine solution in a glycerol droplet. Dotted white line indicates the contour of the glycerol droplet. c The RAEE system in the initial position above the plate, prior to mixing. d Device trajectory for the mixing process, indicated by blue dots and arrows. Movement that occurs while mixing inside a well is indicated by yellow lines (see Supplementary Movie 13). Scale bar: 20 mm. e Mixing procedure in a representative well, where the frame at 0 s indicates the unmixed state and that at 45 s indicates the mixed state. The yellow line indicates the path of the RAEE system inside the well while mixing (see Supplementary Movie 13). f The schematic illustrates the algorithm used by RAEE to achieve homogenous mixing in a 96-well plate.

Acknowledgments
This image is the copyrighted work of the attributed author or publisher, and ZFIN has permission only to display this image to its users. Additional permissions should be obtained from the applicable author or publisher of the image. Full text @ Nat. Commun.