
- Title
-
Distinctive effects of SGLT2 inhibitors on angiogenesis in zebrafish embryos
- Authors
- Huttunen, R., Sainio, A., Hjelt, A., Haapanen-Saaristo, A.M., Määttä, J., Rummukainen, P., Paatero, I., Järveläinen, H.
- Source
- Full text @ Biomed. Pharmacother.

a Overview on the zebrafish experiments with a diagram of the forming intersegmental blood vessels (ISVs) at two time points (23 hpf and 27 hpf), and microscope images of live embryos. The quantified ISVs are marked with white arrows. DA stands for dorsal aorta, hpf for hours post fertilization. Scale bar 200 µm (1b) Quantification of SGLT2 inhibitor-regulated ISV growth. The length of the vessels is given as relative lengths to control embryos. The number of embryos analyzed in 0, 1, 10, 50, 100, and 200 µM of SGLT2 inhibitors: empagliflozin n = 18, n = 18, n = 15, n = 12, n = 16, n = 14, respectively; dapagliflozin n = 7, n = 4, n = 8, n = 8, n = 9, and n = 6, respectively; canagliflozin n = 6, n = 4, n = 9, n = 8, n = 5, and n = 0, respectively. Data were analyzed with Dunnett´s test and shown as mean +SD. ***P < 0.001, **P < 0.01, *P < 0.05. |
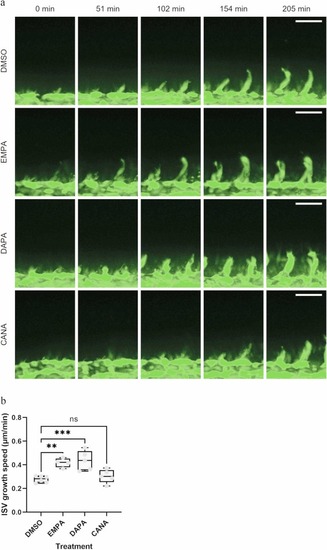
a Transgenic fli1a:EGFP, roy, mitfa fish were anesthesized, immobilized in agarose and imaged from 23 hpf to 27 hpf. Maximum projections of the representative images from 0 to 205 min are shown. Scale bar 50 µm (2b) The elongation speed of ISVs was quantified and analyzed using one-way ANOVA and Dunnett´s post hoc test. Average speed per embryo was used and are presented in the graph. DMSO [solvent control, n = 6 embryos (23 ISVs), EMPA (50 µM empagliflozin, n = 4 embryos (13 ISVs), DAPA (50 µM dapagliflozin, n = 5 embryos (18 ISVs), CANA (50 µM canagliflozin, n = 5 embryos (14 ISVs)]. ***P < 0.001, **P < 0.01, ns=non-significant. |

a Transgenic kdrl:EGFP zebrafish embryos were treated with inhibitors from 23 hpf to 54 hpf and fixed. The samples were imaged with light-sheet fluorescence microscope. Representative images of the sprouting are shown. Scale bar 100 µm.(3b) Quantification of excess sprouting in the embryos. Statistical analysis using Fisher’s exact test, error bars produced with Wilson/Brown algorithm. DMSO, n = 10 embryos; EMPA (50 µM empagliflozin), n = 9 embryos; DAPA (50 µM dapagliflozin), n = 10 embryos; CANA (50 µM canagliflozin), n = 9 embryos. **P < 0.01, ns=non-significant. |
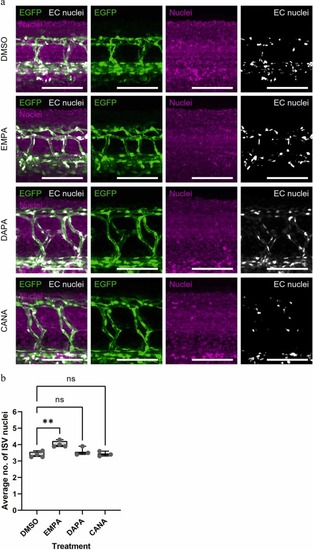
585858a Transgenic kdrl:EGFP zebrafish embryos were treated with SGLT2 inhibitors from 23 hpf to 54 hpf and fixed. Fixed embryos were stained for nuclei with methyl green. The samples were imaged with light-sheet fluorescence microscope. The endothelial nuclei were computationally identified through colocalization between general nuclear signal and vascular EGFP signal. Representative images are shown. Scale bar 100 µM.(4b) Quantification of the number of endothelial nuclei in ISVs. DMSO, n = 4 embryos (34 ISVs); EMPA (50 µM empagliflozin), n = 4 embryos (39 ISVs); DAPA (50 µM dapagliflozin), n = 3 embryos (23 ISVs); CANA (50 µM canagliflozin), n = 3 embryos (30 ISVs). Embryos from the same set as in experiments in Fig. 3 were used in the analysis. Statistical analysis was performed with one-way ANOVA and Dunnett´s post hoc test. **P < 0.01, ns=non-significant. |

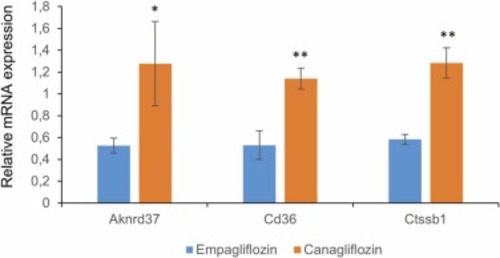
Upregulated gene expression in response to SGLT2 inhibitor treatments. For each gene n = 3. The results shown are representatives of three separate experiments. Data were analyzed with Student´s t-test (false discovery rate Q adjusted to 5%) and shown as mean + SD. **P < 0.01, *P < 0.05. |
Downregulated gene expression in response to SGLT2 inhibitor treatments. For each gene n = 3. The results shown are representatives of three separate experiments. Data were analyzed with Student´s t-test (false discovery rate Q adjusted to 5 and shown as mean + SD. **P < 0.01, *P < 0.05. |
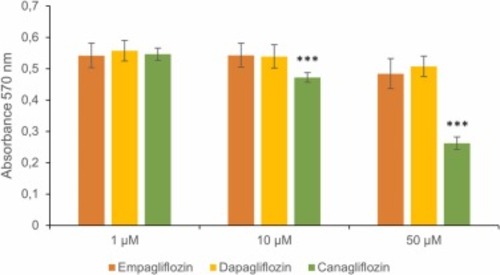
Cell viability in response to SGLT2 inhibitor treatments using the MTT assay. The effect of canagliflozin and empagliflozin were compared with treatments with respective concentrations of empagliflozin (n = 3 for each treatment). The results shown are representatives of three separate experiments. Data were presented as mean + SD. *** P < 0.001. |
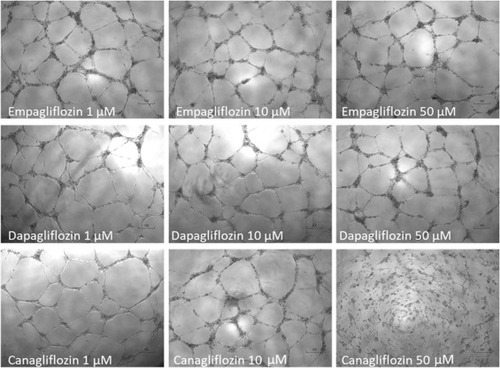
Representative images of tube-formation of cultured HUVECs in response to SGLT2 inhibitor treatments. Note, that canagliflozin at the concentration of 50 µM disrupted the tube-forming capability of the cells. |