
- Title
-
Whole-brain optical access in a small adult vertebrate with two- and three-photon microscopy
- Authors
- Akbari, N., Tatarsky, R.L., Kolkman, K.E., Fetcho, J.R., Bass, A.H., Xu, C.
- Source
- Full text @ iScience
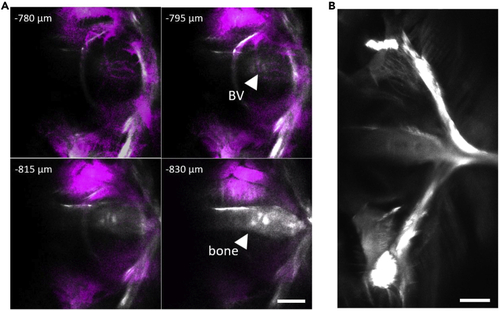
Structural information obtained by SHG enables determining the bottom of the brain (A and B) Determining the bottom of the brain using SHG from the bone under the brain. (A) Frames at four depths near the bottom containing three-photon excited fluorescence in magenta and SHG in white. Bone structure in SHG channel is clearly visible at 830 μm (arrowhead). Bottom of the brain in this example is 795 μm, which is the top right image where clear blood vessel (BV) structure of the brain is visible adjacent to bone. (B) SHG of entire bone under the brain at ∼850 μm depth (tiling of two FOVs; structure matches previous macroscopic characterization of D. dracula bone, see (Conway et al., 2021)). Scale bars indicate 100 μm. |
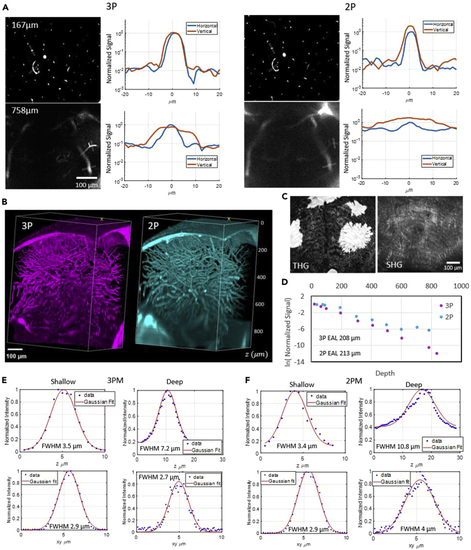
Characterization of 2PM and 3PM images through the deepest part of the adult D. dracula brain–the cerebellum-midbrain boundary Excitation wavelengths of 920 nm at 2 MHz repetition rate and 1280 nm at 333 kHz repetition rate were used for 2PM and 3PM, respectively. (A) Signal-to-background ratio comparison of horizontal and vertical blood vessels for 2PM and 3PM images at two depths inside the brain. In each line profile plot, the values are normalized to the maximum brightness of the horizontal blood vessel. (B) Representative 3D reconstruction of 3PM (left) and 2PM (right) images of fluorescein-labeled blood vessels in the midbrain. (C) Maximum projection of third harmonic generation (THG, left) and second harmonic generation (SHG, right) of all frames containing the skin. Signals were generated by 1280 nm excitation. Pigments produce very bright signal in the THG channel. (D) Characterization of effective attenuation length inside the brain for 2PM and 3PM excitation wavelengths as described in the STAR Methods section. (E) Axial (z) and lateral (xy) width of small blood vessel characterized in shallow (∼100 μm) and deep (∼600 μm) regions with 3PM. (F) Axial (z) and lateral (xy) width of small blood vessel characterized in shallow (∼100 μm) and deep (∼600 μm) regions with 2PM. |

Longitudinal imaging of midbrain vasculature (A and B) Maximum projection of a subset of vasculature in one animal at two timepoints separated by 57 days (A) and in a second animal separated by 7 days (B). Images in A are within the cerebellar-tectal boundary and in D within the optic tectum. Scale bar in lower right frame represents 100 μm for all frames. |
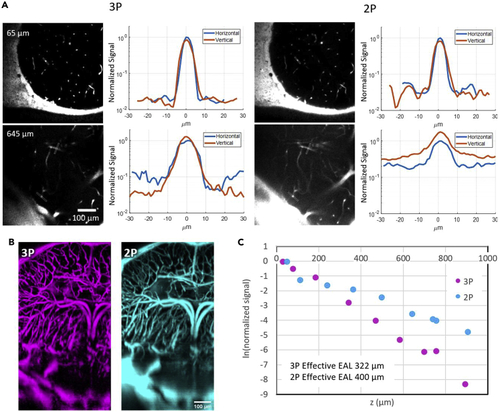
Characterization of 2PM and 3PM (both with 1280 nm excitation) images through shallow and deep regions of the adult D. dracula brain (A) Brightness comparison of horizontal and vertical blood vessels for 3PM and 2PM images at various depths inside the brain. In each line profile plot, the values are normalized to the maximum brightness of the horizontal blood vessel. (B) Maximum projection of a column containing the deepest part of the brain. (C) Characterization of effective attenuation length inside the brain for 2PM and 3PM excitation wavelengths as described in the STAR Methods section. EAL is measured to be 400 μm with 2PM images and 322 μm with 3PM. |

Characterization of blood vessel density in different regions of the brain (A) Blood volume percentage in telencephalon, optic tectum, and cerebellum characterized at various depths (see STAR Methods). (B) Maximum projection of vasculature in telencephalon (T), optic tectum (TeO), and cerebellum (CB). Coronal and horizontal views of vasculature are shown in top and bottom rows, respectively. Dorsal and anterior direction of each row is marked on the leftmost image. |
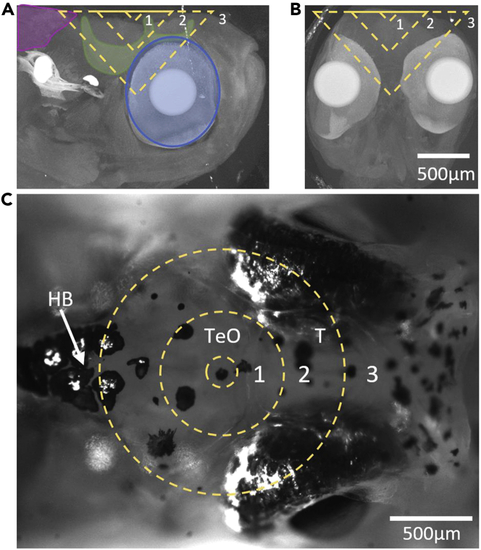
Illustration of head structures that fall within the cone of light for deep imaging in the adult D. dracula brain The dashed lines represent the cone of light for an NA of 1 at depths of 100, 400, and 800 μm labeled as 1, 2, and 3, respectively. (A) Maximum projection of computed tomography (CT) images of the head that contain the right half of the brain. Muscle (magenta), bone (green), and eye pigments (blue) are outlined in the vicinity of the cone of light. (B) Maximum projection of CT images of the head that contain the brain. (C) White light image of the adult head. Abbreviations: T, telencephalon; TeO, optic tectum; HB, hindbrain. |