
- Title
-
AMBRA1 p.Gln30Arg Mutation, Identified in a Cowden Syndrome Family, Exhibits Hyperproliferative Potential in hTERT-RPE1 Cells
- Authors
- Revathidevi, S., Hosomichi, K., Natsume, T., Nakaoka, H., Fujito, N.T., Akatsuka, H., Sato, T., Munirajan, A.K., Inoue, I.
- Source
- Full text @ Int. J. Mol. Sci.
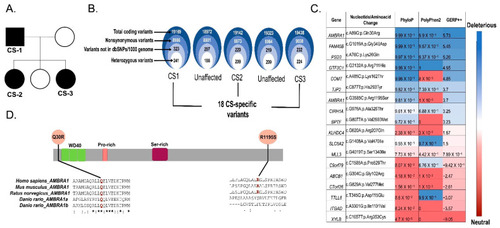
Identification of AMBRA1 Q30R as a possible candidate germline variant using whole exome sequencing data of CS patients. (A) Pedigree of CS family comprising three affected (CS1, CS2, CS3) and two unaffected individuals. (B) Schematic representation of variant filtering and prioritization performed on WES data of the 3 CS probands and 2 unaffected family members. (C) In silico pathogenicity prediction and conservation score of 18 CS-specific variants. (D) Schematic representation of the AMBRA1 protein showing WD domains and CS variants Q30R locating near the WD40 (Tryptophan-Aspartic Acid repeats) domain and R1195S locating at the C-terminal region. Clustal-W2 Multiple sequence alignments at the bottom showed evolutionary conservation of the affected residues (highlighted in red) among species. The symbol * (asterisk) below the multiple sequence alignment indicates positions with a single, fully conserved residue; the symbol: (colon) indicates conservation between groups of strongly similar properties and the symbol. (period) indicates conservation between groups of weakly similar properties. |

AMBRA1 deregulation dynamically altered the cell cycle arrest in hTERT-RPE1 cells. (A) Flow cytometry analysis of AMBRA1-altered hTERT-RPE1 cells. Cells were stained with Ki67, a cell proliferation marker rarely detected in the non-dividing G0 phase and highly expressed in proliferating cells (maximum in the G2 and early M phases), and PI, a DNA marker, staining proportionally to the DNA content of the cell. Staining cells with both Ki67 and PI successfully differentiated each cell cycle phase, represented in boxes of different colors (G0—black; G1—blue; S—pink; G2/M—orange). Analysis was performed in triplicate. A representative graph for each genotype is shown. (B) Bar graph representing the percentage of AMBRA1-depleted and Q30R mutant hTERT-RPE1 cells distributed in the S+G2/M phase under nutrient-sufficient conditions, calculated from the flow cytometry result (A, top). Statistical significance was determined by ANOVA. (C) Bar graph representing the percentage of starved AMBRA1-depleted and Q30R mutant hTERT-RPE1 cells distributed in the S+G2/M phase, calculated from the flow cytometry result ((A), bottom). Statistical significance was determined by ANOVA. (D) Stacked bar graph representing the percentage of AMBRA1-depleted and Q30R mutant hTERT-RPE1 cells distributed in different cell cycle phases under nutrient-sufficient conditions. (E) Stacked bar graph representing the percentage of starved AMBRA1-depleted and Q30R mutant hTERT-RPE1 cells distributed in different cell cycle phases. |
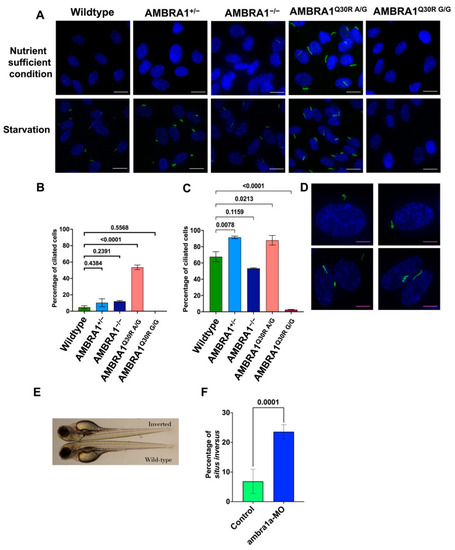
AMBRA1 Q30R mutant hTERT-RPE1 cells exhibited abnormal primary ciliogenesis. (A) Immunocytochemistry images of cells stained with Arl13B (ADP Ribosylation Factor Like GTPase 13B), a primary cilia marker (stained green), and DAPI (4′,6-diamidino-2-phenylindole), a nucleus marker (stained blue). White scale bar = 25 μm (B) Bar graph representing the percentage of ciliated cells in each AMBRA1 genotype in nutrient-sufficient condition. Statistical significance was determined by ANOVA. (C) Bar graph representing the percentage of ciliated cells in each AMBRA1 genotype under starvation. Statistical significance was determined by ANOVA. (D) Representative immunocytochemistry images of AMBRA1Q30R A/G mutant cells stained with Arl13B and DAPI, showing abnormal ciliary structures (curled—top; double cilia—bottom left; spiral—bottom right). Magenta scale bar = 15 μm (E) ambra1a zebrafish CRISPANT showing a situs inversus phenotype. The arrow indicates the reverse orientation of the gall bladder in ambra1a knockout zebrafish (top) and its normal orientation in wildtype zebrafish (bottom). (F) Bar graph representing the percentage of zebrafish showing situs inversus phenotype. Statistical significance was determined using Fisher’s exact test. PHENOTYPE:
|
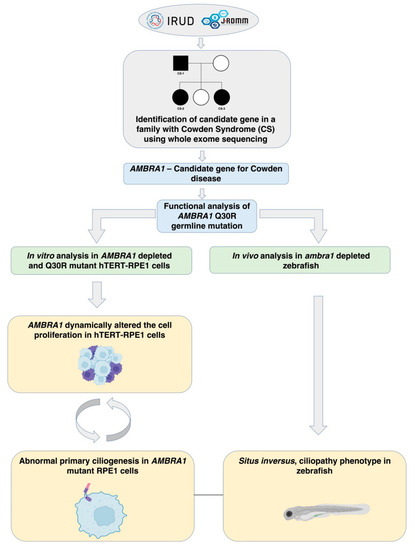
Flowchart for the identification and functional characterization of AMBRA1 as a candidate gene of CS. |