
- Title
-
KLC4 shapes axon arbors during development and mediates adult behavior
- Authors
- Haynes, E.M., Burnett, K.H., He, J., Jean-Pierre, M.W., Jarzyna, M., Eliceiri, K.W., Huisken, J., Halloran, M.C.
- Source
- Full text @ Elife
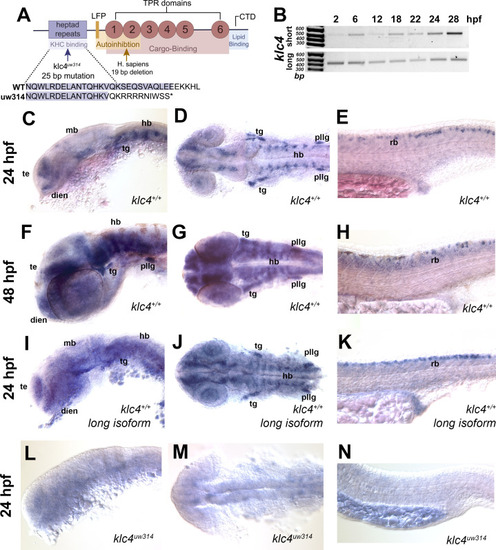
(A) Diagram of the highly conserved domains of KLC4. Arrows indicate where mutation occurs in humans and in our zebrafish mutant. (B) Qualitative RT-PCR showing both long and short klc4 isoforms are expressed throughout development. (C–D) In situ hybridization for klc4 mRNA shown in lateral view (C) or dorsal view (D) of the head in wild type 24 hpf embryos. (E) Lateral view of trunk showing klc4 expression in Rohon-Beard sensory neurons in a 24 hpf wild type embryo. (F–G) klc4 expression in the lateral view (F) or dorsal view (G) of the head of a 48 hpf wild type embryo. (H) Lateral view of trunk showing klc4 expression in the spinal cord of a 48 hpf wild type embryo. (I–K) Lateral (I,K) and dorsal (J) views of klc4 long isoform specific in situ hybridization in wild type 24 hpf embryos. Lateral (L,N) and dorsal (M) views of klc4 in situ hybridization in 24 hpf klc4uw314 mutant embryo head (L,M) and trunk (N) showing little expression of klc4. Te = telencephalon, dien = diencephalon, mb = midbrain, hb = hindbrain, tg = trigeminal ganglion, pllg = posterior lateral line ganglion, rb = rohon beard neuron.
|
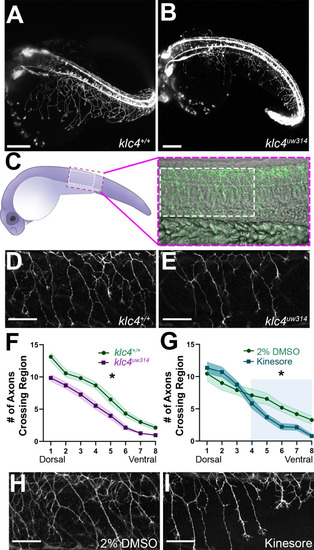
(A–B) Stills taken at approximately 24 hpf from long term light sheet movies of wild type (A) or klc4uw314 mutant (B) embryo development Scale bar = 150µm. (C) Diagram of a 24 hpf embryo indicating the area over the yolk tube extension imaged for axon analysis, with the standard region used for analysis outlined by the white dashed rectangle. (D–E) Representative examples of HNK-1 stained embryos showing peripheral axon branching in wild type (D) and klc4uw314 I embryos. (F–G) Quantification of axon branching across three technical replicates in wild type (n=32) and klc4uw314 mutant (n=32) embryos (F) and DMSO (n=12) and kinesore (n=17) treated embryos (G). Error bars = SEM. Statistical significance was measured by comparing the area under the curve for (F–G) using t-test. For (F), *p=0.0378 for entire graph. For (G), *p=0.0484 for shaded region. (H–I) Representative examples of HNK-1 stained embryos showing peripheral axon branching in DMSO (H) and kinesore treated (I) embryos. Scale bars for D,E,H,I = 50 µm.
|
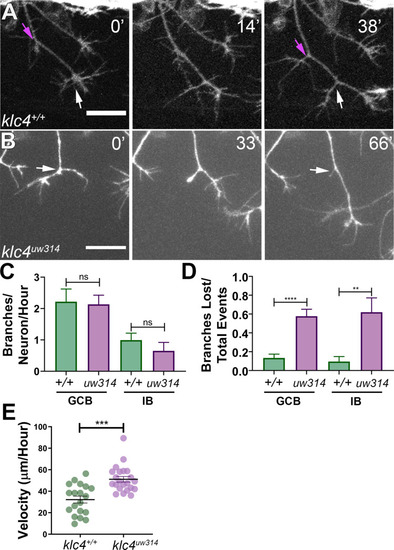
(A) A wild type axon forms stable branches by growth cone bifurcation (GCB, white arrows) and interstitial branching (IB, magenta arrows) over the course of 38’ min. (B) A klc4uw314 mutant axon initiates a branch via GCB (0minutes, white arrow), but one branch begins to retract and is nearly fully gone after 66’ min (panel 3, white arrow). 20 µm scale bar. (C) Quantification of axon branch initiations per neuron per hour in wild type and mutant embryos wild type GCB mean = 2.22 branches/neuron/hr, N=11 neurons from 4 embryos. Klc4uw314 GCB = 2.13 branches/neuron/hr, N=14 neurons from 4 embryos. Wild type IB=0.99 branches/neuron/hr, N=10 neurons from 4 embryos. Klc4uw314 IB = 0.65 branches/neuron/hr, N=8 neurons from 4 embryos. Error bars = SEM. There was no significant difference in branch initiation between wild type and mutant axons. GCB P=0.73, IB P=0.15, Mann–Whitney test. (D) Quantification of branches that retracted after initiation in wild type and klc4uw314 embryos. Data are displayed as a branch loss ratio (branches retracted/total branching events). Branches created by either GCB or IB were both more likely to retract in klc4uw314 embryos (wild type GCB mean = 0.13, N=11 neurons from 4 embryos; klc4uw314 GCB = 0.58, N=14 neurons from 4 embryos; wild type IB = 0.10, N=10 neurons from 4 embryos; klc4uw314 IB = 0.62, N=8 neurons from 4 embryos). **p=0.0055, ****p<0.0001, Mann–Whitney test. Error bars = SEM. (E) Quantification of axon growth velocity. Axons in klc4uw314 mutants grow faster than in wild type. Wild type N=19 axons from 3 embryos. Klc4uw314 N=22 axons from 4 embryos. ***P=0.0001, Mann-Whitney test. Error bars = SEM.
|
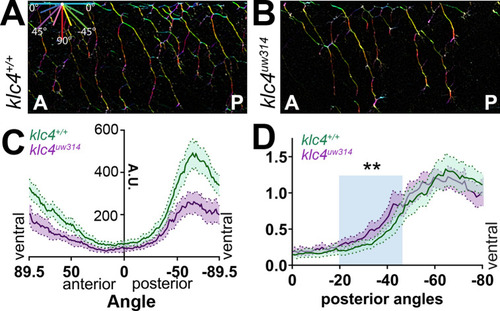
(A–B) A representative region of axon analysis for a 24 hpf wild type (A) and klc4uw314 (B) embryo. The axons are color coded for directionality according to the legend in the upper left corner of (A). (C) Plot of axon directionality in 24 hpf wild type (green) and klc4uw314 mutants (magenta). (D) Axon directionality data was normalized to total signal and posterior angles are displayed to compare directional bias. Area under the curve was measured for shaded area and tested for statistical significance using a t-test. **P=0.0047. For (C–D), error bars = 95% CI. Wild type N=40 embryos, klc4uw314 N=23 embryos.
|
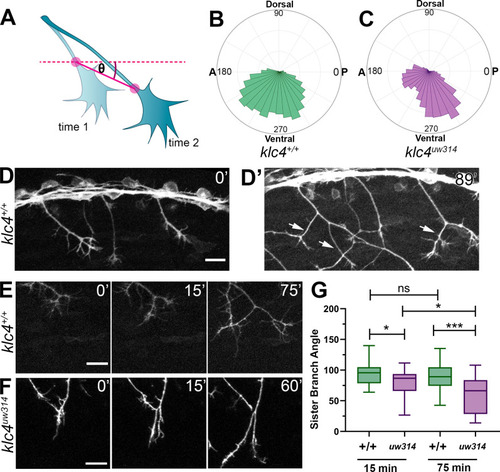
(A) Illustration of how axon growth direction was measured. The angle between an axon’s position in each frame and the frame preceding it was measured. (B–C) These angles were plotted as rose plots to show growth direction distributions. Wild type axons grow evenly between anterior and posterior directions, while klc4uw314 mutant axons show a preference for posterior directed growth. Wild type N=19 axons from 3 embryos. Klc4uw314 N=22 axons from 4 embryos. (D) Stills from a live capture of wild type axon outgrowth, showing that axons often grow posteriorly, but anterior directed branches form over time (D’, white arrows). (E) As a branch forms in a wild type peripheral axon, the angle between sister branches remains consistent as axons grow apart. (F) In klc4uw314 mutants, sister branches do not grow as far apart and the sister branch angle narrows over time compared to wild type. All scale bars = 20 µm. (G) Quantification of the angle between newly formed sister branches at 15 and 75 min after branch creation. Wild type 15’ N=37 branches, klc4uw314 15’ N=36 branches, Wild type 75’ N=25 branches, klc4uw314 75’ N=18 branches. 4 embryos per genotype. *p=0.021, ***p=0.0003, One-way ANOVA. Error bars = 5-95th percentile.
|
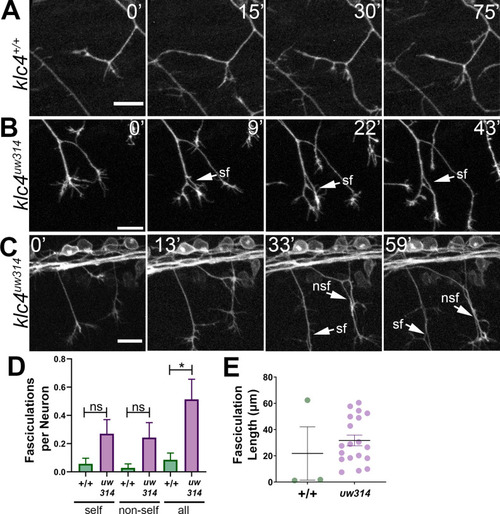
(A) In wild type embryos, the most common response to self or non-self contact between axons is retraction. Two neighboring axons in a wild type embryo make contact (time 0’) and within 30 min, one of the axons has retracted. (B–C) When axons make contact in klc4uw314 embryos, they often fasciculate instead of retracting. This happens with both self-contacts (B–C, sf) and non-self-contacts (C), nsf. All scale bars = 20 µm. (D) Fasciculations per neuron, separated by self or non-self, as well as all fasciculations combined. Wild type N=35 neurons in 4 embryos. Klc4uw314 N=37 neurons in 5 embryos. Error bars = SEM. (E) Fasciculation length was measured from the last frame of each 2 hr imaging period. Wild type N=3 fasciculations, klc4uw314 N=19 fasciculations. Mean with SEM displayed over individual data points. Because fasciculation events are rare in wild-type embryos and a length measurement is conditional on the event occurring, we could not apply a statistical test to assess the significance of the difference in fasciculation length.
|
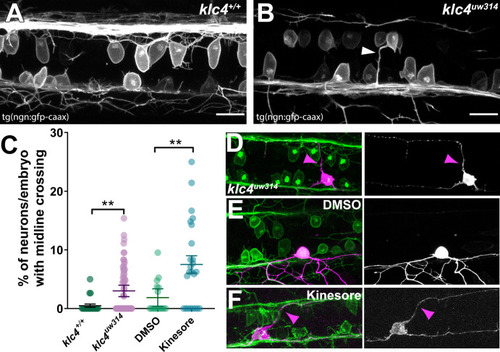
(A–B) Confocal projections (dorsal views) of partial z-stacks containing only the optical sections in the plane of the RB cell bodies within the spinal cord in a wild-type Tg(–3.1ngn1:gfp-caax) embryo (A), or a klc4uw314 Tg(–3.1ngn1:gfp-caax) embryo (B), with an apical protrusion from a neuron crossing the midline and reaching the contralateral side (white arrowhead). Scale bars = 20 µm. (C) The percentage of neurons per embryo that had an apical protrusion crossing the midline of the spinal cord was quantified. **p<0.0052, Mann–Whitney test. Mean with SEM displayed over individual data points. Wild type N=608 neurons from 21 embryos, klc4uw314 N=1496 neurons from 47 embryos, 2% DMSO N=429 neurons from 15 embryos, Kinesore N=595 neurons from 21 embryos. (D–F) Mosaic labeling of individual neurons by injection with –3.1ngn1:gfp-caax DNA into klc4uw314 mutants (D), DMSO-treated embryos I or kinesore-treated embryos (F) showing that apical protrusions (magenta arrowheads) can fasciculate onto the contralateral central axon.
|
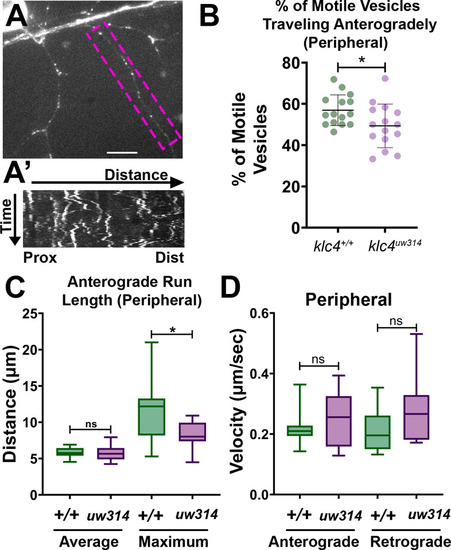
(A) Live RB neuron expressing eGFP-Rab5c. Scale bar = 10 μm. (A’) Representative kymograph of axon segment boxed in magenta in (A).(B) Percentage of anterogradely moving vesicles out of all motile Rab5 vesicles in peripheral axons. The proportion of anterogradely moving vesicles is decreased in klc4314 mutants, *p=0.0372 by Mann-Whitney test; error bars = mean with SD. Wild type N=15 embryos, klc4314 N=15 embryos. (C) Average Rab5 vesicle run length and maximum anterograde vesicle run length in peripheral axons. *p=0.0358, ns p=0.5359, Mann-Whitney test. (D) Rab5 vesicle velocity in peripheral axons. NS by Mann-Whitney test (anterograde p=0.6505, retrograde p=0.0792), wild type N=12 embryos, klc4314 N=11 embryos. For all data, one neuron per embryo was analyzed. Error bars in box and whisker plots represent 5-95th percentile.
|
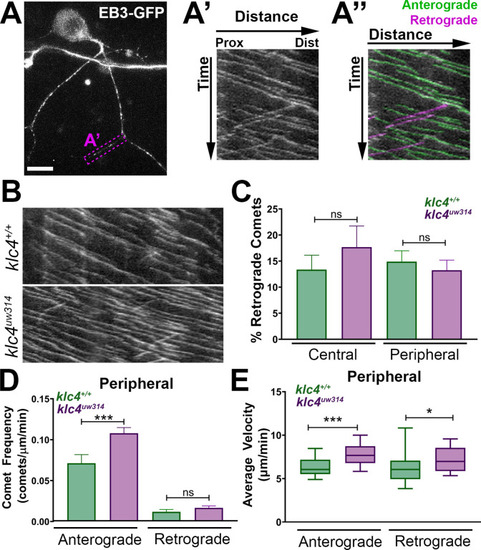
(A-A”) Live RB neuron expressing EB3-GFP, scale bar = 10 μm. Magenta box in (A) indicates axon segment selected for kymograph in (A’). (A”) EB3 comets identified as anterogradely (green) or retrogradely (magenta) directed based on their angle. (B) Representative kymographs from peripheral axon segments of wildtype (top) or klc4uw314 (bottom). (C) Quantification of the percentage of retrograde comets out of all comets imaged for both peripheral and central axons. NS by Mann-Whitney test. (D) Peripheral axon comet frequency. ***p=0.0003, Mann-Whitney test. (E) Peripheral axon comet velocity. ***p=0.0004, *p=0.042, Mann-Whitney test. For all data, error bars = SEM. Wild type central N=8 segments, klc4uw314 central N=15 segments, Wild type peripheral N=26 segments, klc4uw314 peripheral N=48 segments. Wild type data from 10 neurons in 7 embryos. Klc4uw314 data from 13 neurons in 8 embryos. All comets in a kymograph were measured.
|
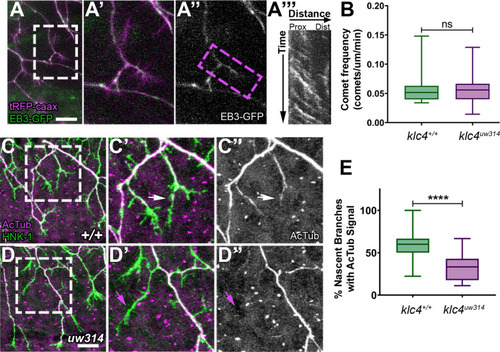
(A) Still image of nascent RB branches expressing EB3-GFP in a live wild type embryo at 23hpf. (A’) Zoom in of the branches outlined in white in (A).(A”) EB3-GFP signal in nascent branches in (A’). (A’’’) Representative kymograph generated from nascent branch outlined in magenta in (A’). (B) Quantification of peripheral axon comet frequency. NS by Mann-Whitney test, p=0.8410. Wild type N=22 nascent branches from 9 embryos, klc4uw314 N=25 nascent branches from 8 embryos. (C-D’’) Representative examples of HNK-1 and acetylated tubulin stained embryos at 24hpf. White arrows in (C’-C’’) indicate nascent branches with tubulin acetylation. Magenta arrows in (D’-D’’) indicate nascent branches lacking tubulin acetylation. (E) Percentage of nascent branches containing acetylated tubulin out of all nascent branches. Fewer nascent branches contained acetylated tubulin in klc4uw314 mutants. ****p<0.0001 by Mann-Whitney test. Wild type N=132 nascent branches from 15 embryos, and klc4uw314 N=143 nascent branches from 16 embryos. Scale bars = 20 μm. Error bars in box and whisker plots represent 5-95th percentile.
|
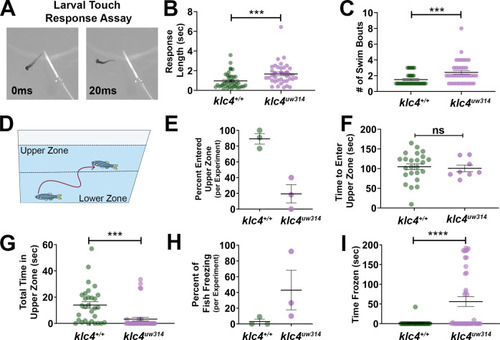
A 3 dpf larva is touched on the tail using a gel loading tip, provoking a swim response. (B) Larval response time was measured starting from beginning of swim to cessation of motion. (C) The number of swim bouts performed by each larva during total post-touch swim time was counted. For B-C, each point represents an individual larva. ***p=0.0005, Mann-Whitney test. Error bars = SEM. Wild type N=45, klc4uw314 N=41. 55 total larva were tested for each genotype, but larva that did not respond were not included in these data. (D) Schematic of the novel tank test design, with upper and lower zones demarcated by the center dotted line. (E) Percentage of fish per experiment that entered the upper zone of the tank during a 3-min exposure to a novel tank. Error bars = SEM. Each point represents one experiment day: wild type N=3 experiments with 30 total fish, klc4uw314 N=3 experiments with 39 total fish. (F) The time it took for individual fish to first cross into the upper zone during a 3-min exposure to a novel tank. Points represent individual fish, error bars = SEM. Wild type N=24, klc4uw314 N=8. Fish that did not cross into the upper zone are not represented in this data. NS by t-test, p=0.7766. (G) The total time fish spent in the upper zone of the novel tank during a 3-min exposure. Points represent individual fish, ***p=0.0002 by t-test, error bars = SEM. Wild type N=30, klc4uw314 N=39. (H) Percentage of fish to freeze per experiment during a 3-min exposure to the novel tank. Error bars = SEM. Each point represents one experiment day: wild type N=3 experiments with 30 total fish, klc4uw314 N=3 experiments with 39 total fish. (I) The total time fish spent frozen during a 3-min exposure to a novel tank. Points represent individual fish, ****p<0.0001 by Mann-Whitney test, error bars = SEM. Wild type N=30, klc4uw314 N=39.
|
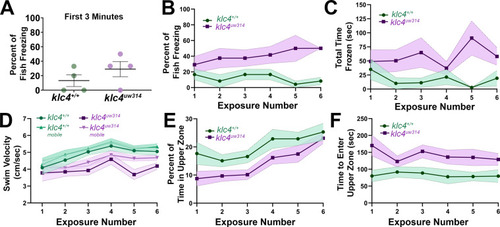
(A) Percentage of fish per experiment that froze during the first 3 min of a 10-min initial exposure to a novel tank. (B) Plot of the percentage of fish that froze during the course of six 10-min exposures to the same novel tank. (C) Plot of the average time spent frozen during the course of six 10-min exposures to the same novel tank. (D) Plot of the average total and mobile-only swim velocities of fish during each of six 10-min exposures to the same novel tank. Mobile-only velocity excludes periods of time the fish spent at a velocity of 0 cm/s (frozen). (E) Plot of the percentage of time that fish spent in the upper zone of the tank during the course of six 10-min exposures to the same novel tank. (E) Plot of the average time it took for a fish to first enter the upper zone of the tank during the course of six 10-min exposures to the same novel tank. For all data, N=4 groups per genotype, 23 total fish per genotype. Error bars = SEM. For figures D-F, videos that could not be automatically tracked were omitted (for WT, 6/138, for klc4uw314, 4/138).
|