
- Title
-
Intrinsic myocardial defects underlie an Rbfox-deficient zebrafish model of hypoplastic left heart syndrome
- Authors
- Huang, M., Akerberg, A.A., Zhang, X., Yoon, H., Joshi, S., Hallinan, C., Nguyen, C., Pu, W.T., Haigis, M.C., Burns, C.G., Burns, C.E.
- Source
- Full text @ Nat. Commun.
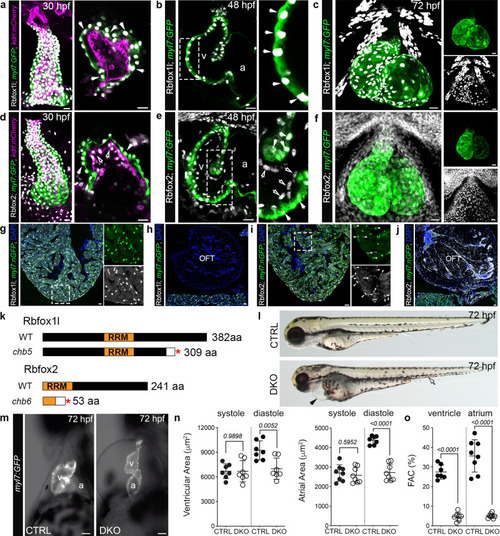
Rbfox1l and Rbfox2 function redundantly to support cardiovascular development in zebrafish.
a–f Confocal z-stacks and single optical sections of 30, 48, and 72 hpf hearts from Tg(myl7:GFP);Tg(kdrl:mCherry) zebrafish following immunostaining for GFP, mCherry, Rbfox1l, and Rbfox2 as indicated. White arrows show Rbfox1l or Rbfox2 within cardiomyocytes. Open arrows show Rbfox2 in endocardial cells. Boxed regions are shown at higher magnification. Split channels of (c) and (f) are shown. g–j Merged confocal images of cardiac sections from Tg(myl7:nGFP) adult zebrafish following immunostaining for GFP, Rbfox1l, and Rbfox2 and counterstained with DAPI. Boxed regions in g and i are shown as split channels. White arrowheads show Rbfox2 in cardiomyocytes. Open arrowheads show Rbfox2 in presumptive endocardial cells. k Diagrams of wildtype Rbfox1l and Rbfox2 and the predicted protein products of the rbfox1lchb5 and rbfox2chb6. Red asterisks mark the locations of premature stop codons. White boxes indicate divergent amino acids. l Brightfield images of 72 hpf CTRL and DKO embryos. Black arrowhead highlights pericardial edema. Open arrowhead highlights pooled blood. m Brightfield images with fluorescent overlay of Tg(myl7:GFP) signal in hearts from 72 hpf CTRL and DKO embryos. n, o Dot plots showing chamber areas during systole and diastole and percent fractional area change (%FAC) in 72 hpf CTRL and DKO hearts. Sample sizes and Statistics: (a–j) Little to no variation in expression was observed. n = 10 embryos/developmental stage/condition; n = 6 adults/condition. n, o Each dot represents one embryo in all graphs. Data are presented as mean values +/− one SD. Statistical significance was determined by an unpaired, two-tailed Student’s t-test assuming equal variances. P values are shown. Source data are provided as a Source Data file. Abbreviations: v ventricle, a atrium, OFT outflow tract, aa amino acid, RRM RNA-recognition motif. Scale bars: 20 μm. EXPRESSION / LABELING:
PHENOTYPE:
|
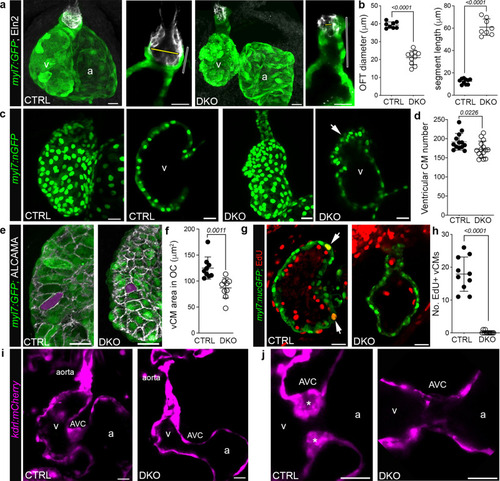
Rbfox-deficient zebrafish display cardiovascular defects overlapping those in HLHS hearts.
a Confocal z-stacks or single optical sections of hearts or OFTs from 72 hpf CTRL or DKO embryos carrying the Tg(myl7:GFP) reporter following immunostaining for GFP (green) and Elastin2 (Eln2; white). Yellow bars, OFT diameter. Open bars, myocardial segment length. b Dot plots showing OFT diameter and myocardial segment length. c Confocal z-stacks or single optical sections of hearts from 72 hpf CTRL and DKO embryos carrying the Tg(myl7:nGFP) transgene following immunostaining for GFP (green). Arrow highlights myocardial disorganization in the DKO ventricle. d Dot plot of ventricular cardiomyocyte numbers. e Confocal z-stacks of the ventricular OC from 72 hpf CTRL and DKO embryos carrying the Tg(myl7:GFP) reporter following immunostaining for GFP (green) and ALCAMA (white). Magenta overlay shows the area of a representative OC cardiomyocyte. f Dot plot showing the average area of ventricular OC cardiomyocytes. g Single optical section of the ventricle from 72 hpf CTRL and DKO embryos carrying the Tg(myl7:nGFP) transgene following immunostaining for GFP (green) and EdU (red). White arrows highlight GFP+; EdU+ cardiomyocytes. h Dot plot showing the number of EdU+ ventricular cardiomyocytes. i Single optical sections of hearts from live 72 hpf CTRL and DKO embryos carrying the Tg(kdrl:mCherry) transgene. j Single optical sections of the AVC. Asterisks mark endocardial cushions. Sample Sizes and Statistics: (b, d, h) Each dot represents one embryo. f Each dot represents the average area of 8 outer curvature cardiomyocytes from 8 CTRL and 10 DKO hearts. Data are presented as mean values +/− one SD. Statistical significance was determined by an unpaired, two-tailed Student’s t-test assuming equal variances. P values are shown. Source data are provided as a Source Data file. Abbreviations: v ventricle, a atrium, CM cardiomyocyte, OC outer curvature, AVC atrioventricular canal. Scale bars: 20 μm. EXPRESSION / LABELING:
PHENOTYPE:
|
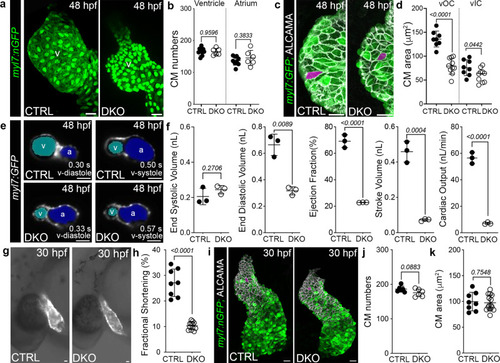
Impaired myocardial function is the earliest cardiovascular defect observed in Rbfox-deficient embryos.
a Confocal projections of 48 hpf CTRL and DKO hearts carrying the Tg(myl7:nGFP) transgene immunostained for GFP (green). b Dot plot showing cardiomyocyte numbers. c Confocal projections of 48 hpf ventricular OCs from CTRL and DKO embryos carrying the Tg(myl7:GFP) reporter immunostained for GFP (green) and ALCAMA (white). Magenta overlay of OC cardiomyocytes. d Dot plot showing the average area of ventricular OC and IC cardiomyocytes. e Single-plane images of 48 hpf CTRL and DKO embryos carrying the Tg(myl7:GFP) transgene. Atrial (blue) and ventricular (cyan) lumens are shown. f Dot plots showing ventricular end-systolic volume (ESV) and end-diastolic volume (EDV) measured with CFIN that were used to calculate ejection fraction (EF), stroke volume (SV), and cardiac output (CO). g Brightfield images with fluorescent overlay of Tg(myl7:GFP) reporter signal in 30 hpf CTRL and DKO embryos. h Dot plot showing % fractional shortening at the arterial pole. i Confocal projections of 30 hpf CTRL and DKO hearts carrying the Tg(myl7:nGFP) transgene immunostained with anti-GFP (green) and anti-ALCAMA (white). Magenta overlay of arterial pole cardiomyocytes. j, k Dot plots showing cardiomyocyte numbers and average cell areas. Sample sizes and Statistics: (b, f, h, j) Each dot represents one embryo. d Each dot represents the average area of 8 OC cardiomyocytes and 6 IC cardiomyocytes from 8 CTRL and 10 DKO hearts. k Each dot represents the average area of 8 cardiomyocytes from 8 CTRL and 12 DKO hearts. Data are presented as mean values +/− one SD. Statistical significance was determined by an unpaired, two-tailed Student’s t-test assuming equal variances. P values are shown. Source data are provided as a Source Data file. Abbreviations: v ventricle, a atrium, OC outer curvature, IC inner curvature. Scale bars: 20 μm. |

Rbfox proteins are required for expression and alternative splicing of transcripts encoding mitochondrial, cytoskeletal, and sarcomere components.
a GO analysis showing biological processes associated with downregulated transcripts in DKO hearts. Yellow represents mitochondria-associated terms, while pink shows heart muscle terms. b Pie chart depicting the proportions of differential alternative splicing events in each category. Abbreviations: Skipped exon (SE), mutually exclusive exon (MXE), alternative 3’ splice site (A3SS), alternative 5’ splice site (A5SS), and retained intron (RI). c Volcano plot showing the inclusion level difference (IncLevDiff; CTRL Inclevel - DKO Inclevel) and False Discovery Rates (FDR) for differential alternative splicing events (0 uncalled replicates; FDR < 0.01; |Incleveldifference | >0.1). d Schematic representing differential alternative splicing events of select transcripts between CTRL and DKO hearts. Blue arrows define primer sites used in the RT-PCR assay to calculate percent spliced in (PSI) shown in (e). e RT-PCR validation of 3 alternative splicing events identified by rMATS. PSI is shown. Sample sizes and Statistics: For RNA-sequencing, n = 8 biological independent replicates per cohort with 35–70 pooled hearts per replicate. PHENOTYPE:
|
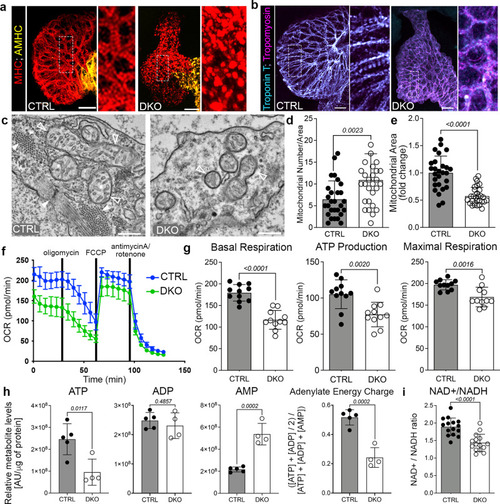
Rbfox proteins mediate sarcomere assembly and mitochondrial respiration.
a, b Merged confocal projections of 48 hpf CTRL or DKO hearts immunostained for MHC and AMHC (a), and Troponin T and Tropomyosin (b). Magnified views of boxed regions are shown. c Transmission electron micrographs (TEMs) of ventricular cardiomyocytes in 48 hpf CTRL or DKO. White arrowheads highlight sarcomere bundles and a Z-line in CTRL. Open arrowheads highlight mitochondria. d, e Dot plots depicting mitochondrial numbers per area and fold change in mitochondrial area. f Graph of seahorse mito stress test to measure oxygen consumption rates (OCR) of 48 hpf CTRL or DKO embryos. Drug addition is indicated. g Dot plots from raw data in f. h Dot plots of metabolomics data in 24 hpf CTRL or DKO embryos. i Dot plot showing NAD+/NADH ratio at 48 hpf by GloAssay. Sample sizes and statistics: (a, b) Little to no variation in expression was observed. n = 10 embryos/cohort. c n = 3 embryos/cohort. d, e Each dot represents the number of mitochondria per 8000X section and fold change in mitochondrial area (CTRL: 11 sections from Heart 1, 7 sections from Heart 2, and 9 sections from Heart 3; DKO: 8 sections from Heart 1, 10 sections from Heart 2, and 11 sections from Heart 3). f n = 3 biologically independent replicates with one representative graph shown. Each dot in (f) represents 11 embryos per cohort. h n = 4 CTRL or 5 DKO biological replicates with 40 deyolked 24 hpf embryos/replicate. All metabolites were normalized by protein level. i n = 3 embryos/dot. Data are presented as mean values+/− one SD. Statistical significance was determined by an unpaired, two-tailed Student’s t-test assuming equal variances. P values are shown. Source data are provided as a Source Data file. Scale bars: 20 μm. |

Aortic stenosis and valve atresia in rbfox-deficient zebrafish arise secondary to impaired pump function.
a Brightfield images of 72 hpf CTRL or DKO embryos in the absence or presence of the Tg(myl7:rbfox1l) transgene (Tg). Black arrow highlights pericardial edema in DKO. b Dot plot showing % fractional area change (FAC) of ventricles in 72 hpf CTRL or DKO embryos in the absence or presence of the Tg(myl7:rbfox1l) transgene. c Confocal projections of hearts in 72 hpf CTRL or DKO embryos in the absence or presence of the Tg(myl7:rbfox1l) transgene following immunostaining for Tropomyosin. Boxed regions are shown below each panel at higher magnification. d Confocal sections of outflow tracts (OFTs) in 72 hpf CTRL or DKO embryos in the absence or presence of the Tg(myl7:rbfox1l) transgene following immunostaining for Tropomyosin (green) and Eln2 (white). White lines depict OFT diameter. e Dot plot showing quantification of OFT diameter. f Confocal sections of the atrioventricular canal in 72 hpf CTRL or DKO embryos in the absence or presence of the Tg(myl7:rbfox1l) transgene after immunostaining for Troponin T (green) and ALCAMA (pink). White arrowheads mark the endocardial cushions that are lacking DKO. g Boxed region approximates the areas shown at higher magnification in f. Sample sizes and Statistics: (a, b) n = 11 CTRL, n = 15 DKO, n = 12 CTRL+ Tg, n = 23 DKO+ Tg; (c) n = 10/cohort; (d, e): n = 11 CTRL, n = 10 DKO, CTRL + Tg, DKO + Tg (f) n = 9 CTRL+ or – the transgene and n = 6 DKO+ or – the transgene. Each dot represents 1 embryo in both graphs. Data are presented as mean values +/− one SD. Statistical significance was determined by ordinary one-way ANOVA Dunnet’s multiple comparisons test. P values are shown. Source data are provided as a Source Data file. Scale bars: 20 μm. EXPRESSION / LABELING:
PHENOTYPE:
|
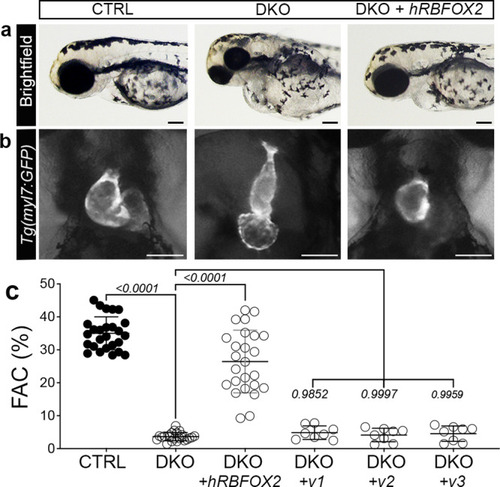
Injection of human RBFOX2 mRNA restores cardiovascular development in rbfox-deficient zebrafish, while HLHS-linked RBFOX2 variants fail to rescue.
a Brightfield images of 72 hpf CTRL, DKO, and DKO embryos injected with wildtype human RBFOX2 (hRBFOX2) mRNA. b Brightfield images with fluorescent overlay of Tg(myl7:GFP) reporter signal in hearts of 72 hpf CTRL, DKO, and DKO embryos injected with wildtype hRBFOX2 mRNA. c Dot plot showing % FAC of 72 hpf ventricles in the following cohorts: uninjected CTRL, uninjected DKO, DKO+ wildtype hRBFOX2, DKO+ RBFOX2-v1, v-2, or v-3 mRNA where hRBFOX2 harbors a variant (v) previously discovered in patients with HLHS. Sample sizes and statistics: (c) uninjected CTRL, n = 26; uninjected DKO, n = 23; DKO+ wildtype human RBFOX2, n = 25; DKO + hRBFOX2 v1, v2, or v3 (n = 8 per group). Each dot represents 1 embryo. Data are presented as mean values +/− one SD. Statistical significance was determined by ordinary one-way ANOVA Dunnet’s multiple comparisons test. P values are shown. Source data are provided as a Source Data file. Scale bars: 20 μm. |