
|
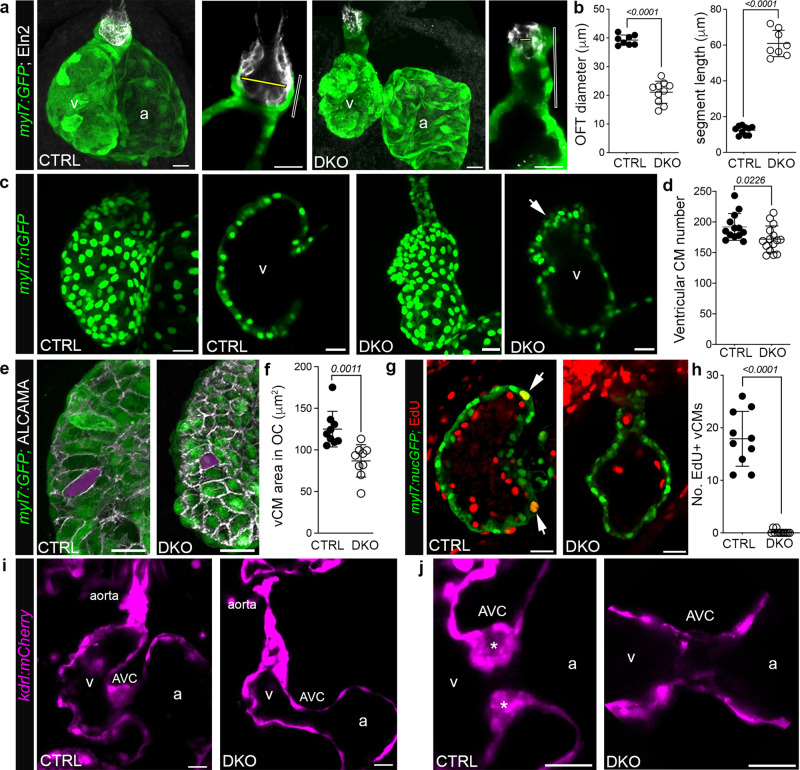
Fig. 2
a Confocal z-stacks or single optical sections of hearts or OFTs from 72 hpf CTRL or DKO embryos carrying the Tg(myl7:GFP) reporter following immunostaining for GFP (green) and Elastin2 (Eln2; white). Yellow bars, OFT diameter. Open bars, myocardial segment length. b Dot plots showing OFT diameter and myocardial segment length. c Confocal z-stacks or single optical sections of hearts from 72 hpf CTRL and DKO embryos carrying the Tg(myl7:nGFP) transgene following immunostaining for GFP (green). Arrow highlights myocardial disorganization in the DKO ventricle. d Dot plot of ventricular cardiomyocyte numbers. e Confocal z-stacks of the ventricular OC from 72 hpf CTRL and DKO embryos carrying the Tg(myl7:GFP) reporter following immunostaining for GFP (green) and ALCAMA (white). Magenta overlay shows the area of a representative OC cardiomyocyte. f Dot plot showing the average area of ventricular OC cardiomyocytes. g Single optical section of the ventricle from 72 hpf CTRL and DKO embryos carrying the Tg(myl7:nGFP) transgene following immunostaining for GFP (green) and EdU (red). White arrows highlight GFP+; EdU+ cardiomyocytes. h Dot plot showing the number of EdU+ ventricular cardiomyocytes. i Single optical sections of hearts from live 72 hpf CTRL and DKO embryos carrying the Tg(kdrl:mCherry) transgene. j Single optical sections of the AVC. Asterisks mark endocardial cushions. Sample Sizes and Statistics: (b, d, h) Each dot represents one embryo. f Each dot represents the average area of 8 outer curvature cardiomyocytes from 8 CTRL and 10 DKO hearts. Data are presented as mean values +/− one SD. Statistical significance was determined by an unpaired, two-tailed Student’s t-test assuming equal variances. P values are shown. Source data are provided as a Source Data file. Abbreviations: v ventricle, a atrium, CM cardiomyocyte, OC outer curvature, AVC atrioventricular canal. Scale bars: 20 μm.