
- Title
-
A dual involvement of Protocadherin-18a in stromal cell development guides the formation of a functional hematopoietic niche
- Authors
- Touret, A.L., Vivier, C., Schmidt, A., Herbomel, P., Murayama, E.
- Source
- Full text @ Development
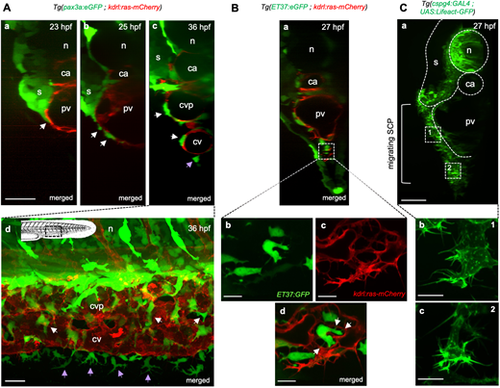
Stromal-endothelial cell interactions during SCP migration and caudal vein plexus formation. (A-C) Confocal spinning-disk images of live embryos of the indicated transgenic backgrounds and developmental stages. (Aa-Ac) Optical transverse sections reconstituted by Imaris software. White arrows indicate SCPs migrating on the primordial vein or within the forming CVP; purple arrow indicates an FMC. Scale bar: 30 µm. (Ad) Lateral view. Schematic indicates the region shown. GFPhigh and GFPdim cells are neural crest-derived pigment cells and SCP derivatives, respectively. Scale bar: 20 µm. (Ba) Optical transverse section. (Bb-Bd) Magnified projections from three confocal planes spaced by 0.6 µm at the region indicated by the dashed square in (Ba), ventral to the primordial vein, where angiogenesis is building the CVP. White arrows point to stromal cell interaction with endothelial cells via filopodia. Scale bars: 10 µm. (Ca) Optical transverse section. SCPs first migrate in a 2D mode in close contact with the primordial vein (dashed square marked 1) then in a more 3D mode when they co-migrate with endothelial cells (dashed square marked 2). Scale bar: 20 µm. (Cb,Cc) Magnified images of SCPs in 2D (Cb) and 3D (Cc) migration modes. Scale bars: 10 µm. ca, caudal artery; cv, caudal vein; cvp, caudal vein plexus; n, notochord; pv, primordial vein; s, somites. |
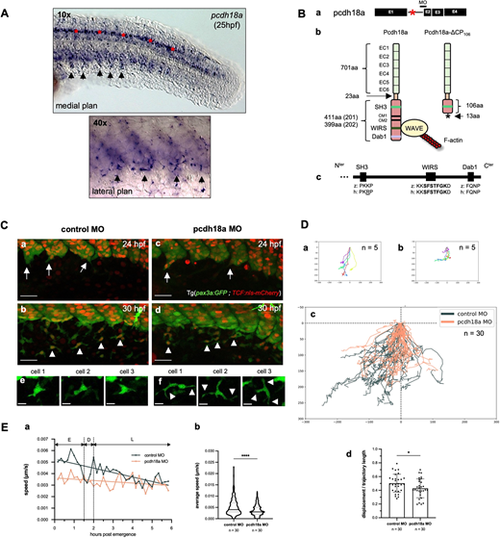
Pcdh18a is involved in the migration of SCPs. (A) VE-DIC microscopy of whole-mount in situ hybridization for pcdh18a at 25 hpf. Arrows point to pcdh18a-expressing cells at the ventral side of caudal somites, including emigrating SCPs. Some spinal cord neurons are also labeled (red asterisks). The dashed square delimits the region enlarged below. (Ba) The splice-blocking MO used in this study targets the intron 1-exon (E) 2 junction of pcdh18a. Asterisk indicates the intron retained in the morphant. (Bb) Injection of this MO leads to retention of the first intron and a premature STOP codon in it, resulting in a protein truncated after the 106th amino acid of the ICD of Pcdh18a. (Bc) Alignment of SH3, WIRS and Dab1 domains in the ICD of human (h) PCDH18 and zebrafish (z) Pcdh18a. (Ca-Cd) Time-lapse confocal imaging of Tg(pax3a:GFP; TCF:nls-mCherry) control or pcdh18a-ΔCP106 morphant embryos (maximum projections). Arrows and arrowheads indicate delaminating and migrating SCPs/SCs, respectively. Scale bars: 30 µm. (e,f) Snapshots of single SCPs during mid-migration (26-29 hpf). Scale bars: 10 µm. (Da,Db) Individual tracks of five leader SCPs from a control (Da) and a pcdh18a-ΔCP106 morphant embryo (Db); cell positions plotted every 10 min over 6 h; x,y coordinates of the SCPs' starting points (within the somite ventral clusters) are set to (0,0), and negative or positive values on the x-axis indicate anterior or posterior migration, respectively. (Dc) Overlay of individual tracks of the 30 leader cells followed in control (black) and pcdh18a-ΔCP106 morphant (orange) embryos. nexp=3, nembryos=6 for controls and morphants. (Dd) Trajectory straightness of the tracked leader SCPs (mean±s.d.; *P=0.038; unpaired, two-tailed Student's t-test). (Ea) Average speed of the tracked leader SCPs over time. E, early migration; D, decision phase; L, late migration. (Eb) Violin plot of the speed of leader SCPs during their early migration (median±s.d.; ****P<0.0001; Mann–Whitney test). |
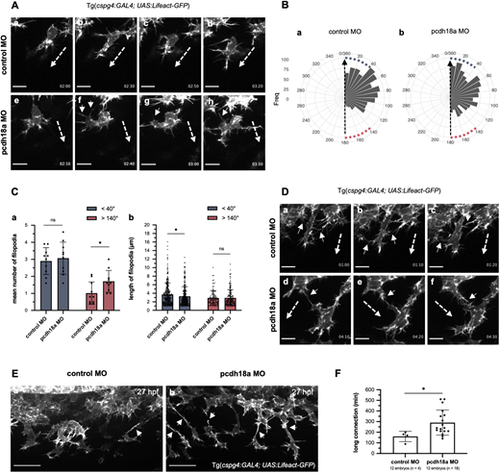
Pcdh18a modulates cell protrusions and connections of migrating SCPs. (Aa-Ah) Time-lapse confocal images of migrating SCP leader cells from control and pcdh18a-ΔCP106 morphant Tg(cspg4:GAL4; UAS:Lifeact-GFP) embryos by 26 hpf (see also Movie 3), extracted at 20-30 min intervals. Time from initiation of SCP migration is shown in the lower right of each panel. Dashed and short arrows indicate the direction of SCP migration and filopodia extending in the opposite direction, respectively. Scale bars: 10 µm. (Ba,Bb) Quantification of the frequency of filopodia according to their angle relative to the direction of migration (dashed arrow) in control (Ba) and pcdh18a-ΔCP106 (Bb) morphant embryos. Angles <40° and >140° were considered close to the direction of the migration (blue squares) and opposite to the direction of migration (red squares), respectively. The linear mixed-effect model indicates that pcdh18a-ΔCP106 morphants have relative angles increased on average by 14.9° compared with controls (P=0.0041). (Ca) Quantification of the mean number of filopodia in sense (<40°, blue) or opposite direction (>140°, red) projected from migrating SCPs in control and pcdh18a-ΔCP106 morphant embryos. Each dot represents a biological replicate from five independent experiments (n=10 for controls and morphants) (mean±s.d.; ns, P=0.6666; *P=0.0284; unpaired, two-tailed Student's t-test). (Cb) Quantification of the length of filopodia in the sense (blue) or opposite (red) direction of cell migration. Each dot represents a single filopodium (n=392 for controls, 478 for pcdh18a morphants; mean±s.d.; ns, P=0.5190; *P=0.0247; Mann–Whitney test). (Da-Df) Time-lapse confocal images of migrating leader SCPs from control and morphant Tg(cspg4:GAL4; UAS:Lifeact-GFP) embryos around 25-28 hpf, extracted at 10 min intervals. In controls, neighboring leader cells interact by brief contact of their filopodia (Da-Dc, arrows), which do not change their direction of migration (dashed arrows), whereas in morphants they tend to have longer contacts (Dd-Df, arrows), which can change their trajectory. Scale bars: 10 µm. (Ea,Eb) Confocal spinning-disk images of live Tg(cspg4:GAL4; UAS:Lifeact-GFP) embryos at 27 hpf. Leader cells tend to show longer connections to follower cells (arrows) in morphants (Eb) compared with controls (Ea). Scale bars: 30 µm. (F) Quantification of the duration of long (>10 µm) cell connections between leader and follower cells (mean±s.d.; *P=0.0113; Mann–Whitney test). See also Movie 4. |
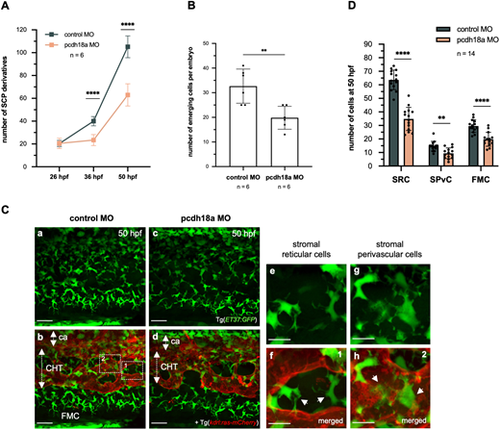
Pcdh18a C-terminal truncation reduces the number of stromal cells. (A) Counting of ET37:GFP+ SCP derivatives in the developing ventral tail over a five-somite width at 26, 36 and 50 hpf. Plots represent biological replicates from a single experiment; n=6 for control and pcdh18a-ΔCP106 morphants (mean±s.d.; ****P<0.0001; unpaired, two-tailed Student's t-test). (B) Counts of the number of emerging SCPs within a five-somite width, from 24 to 40 hpf (from the same time-lapse confocal sequences as in Fig. 2C), n=6 embryos per condition (mean±s.d.; **P=0.0037; unpaired, two-tailed Student's t-test). (Ca-Cd) Confocal spinning-disk projections of live Tg(ET37:GFP; kdrl:ras-mCherry) control or pcdh18a-ΔCP106 embryos at 50 hpf. ca, caudal artery. Scale bars: 30 µm. (Ce-Ch) Dashed boxes in Cb indicate the regions enlarged in Ce-Ch, which show the two stromal cell types found in the CHT at 50 hpf. SRCs interconnect the vascular segments of the plexus and seem to maintain its architecture (Ce, and arrows in Cf), whereas SPvCs are spread along and around the vessels (Cg, and arrows in Ch). Scale bars: 10 µm. (D) Numbers of the three types of SCP derivatives – SRCs and SPvCs in the CHT, and FMCs in the caudal fin – in 14 embryos per condition, counted over a five-somite width (mean±s.d.; **P=0.0011; ****P<0.0001; unpaired, two-tailed Student's t-test). |
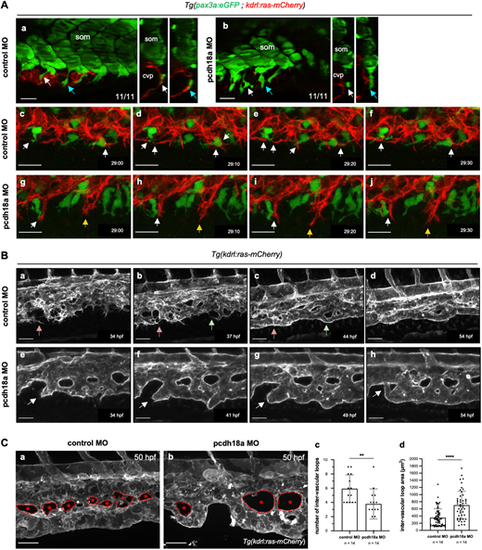
Pcdh18a truncation impacts on venous plexus morphogenesis. (Aa,Ab) Confocal single-slice images and orthogonal (transverse) views of control (Aa) and pcdh18a (Ab) MO-injected Tg(pax3a:eGFP; kdrl:ras-mCherry) embryos at 26 hpf. White and blue arrows point to the same cells (SCPs) shown in transverse view on the right; n=11 control and 11 pcdh18a MO-injected embryos, from four independent experiments. cvp, caudal vein plexus; som, somite. (Ac-Aj) Time-lapse confocal imaging of the forming CVP of control (Ac-Af) and pcdh18a-ΔCP106 morphant (Ag-Aj) embryos (see also Movie 5). Images were extracted at 10 min intervals from 29 hpf to 29.5 hpf. Dynamic interactions between stromal and endothelial cells (white arrows) were frequent in control embryos whereas in pcdh18a morphants endothelial cells migrated ventralwards apparently regardless of stromal cells (yellow arrows). Scale bars: 20 µm. (Ba-Bh) Time-lapse confocal images from control (Ba-Bd) and pcdh18a (Be-Bh) MO-injected Tg(kdrl:ras-mCherry) embryos at later stages (34-54 hpf). See also Movie 6. In the control, red and green arrows follow the formation of new vascular segments. In the morphant, white arrows point to the abnormal tubulogenesis of the definitive caudal vein. Scale bars: 30 µm. (C) Morphological differences in the IVLs. (Ca,Cb) Confocal spinning-disk acquisitions of live transgenic Tg(kdrl:ras-mCherry) control or pcdh18a MO-injected embryos at 50 hpf. IVLs are indicated by asterisks and the border of each IVL is delineated by a dashed line. Scale bars: 30 µm. (Cc,Cd) Number (Cc) and surface in µm2 (Cd) of IVLs over a five-somite width in controls and morphants; n=14 embryos per condition, from two independent experiments (mean±s.d.; **P=0.0066; ****P<0.0001; Mann–Whitney test). |
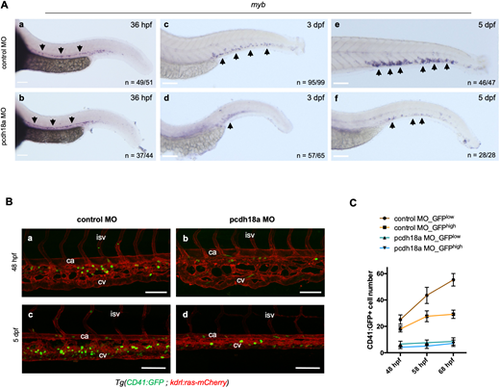
The Pcdh18a cytoplasmic domain is required for HSPC lodgment and expansion in the CHT. (A) Whole-mount in situ hybridization for myb expression on control or pcdh18a-ΔCP106 morphant embryos at the indicated developmental stages. Arrows indicate myb-expressing cells. (Ba-Bd) Confocal maximum projections of control or pcdh18a MO-injected Tg(CD41:GFP; kdrl:ras-mCherry) embryos at 48 hpf (Ba,Bb) and larvae at 5 dpf (Bc,Bd). ca, caudal artery; cv, caudal vein; isv, inter-somitic vessel. (C) Counts of CD41:GFPlow HSPCs and CD41:GFPhigh pro-thrombocytes in the CHT over a nine-somite width at 48, 58 and 68 hpf (n=6 and 5 larvae for control and pcdh18a morphants, respectively, pooled from three independent experiments), monitored from time-lapse imaging sequences starting at 48 hpf for 20 h. Scale bars: 100 µm. |
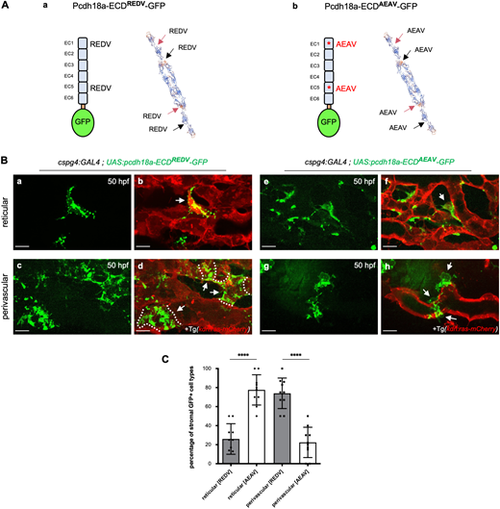
The extracellular domain of Pcdh18a mediates the adhesion of stromal cells to endothelial cells. (Aa,Ab) Fusion proteins expressed in SCPs via the Gal4/UAS system, with the ICD of Pcdh18a substituted by GFP, and tertiary structure prediction for WT (Aa) and mutant (Ab) forms of the ECD, using SWISS-MODEL (expasy.org). Red and black arrows point to two REDV (WT) or AEAV (mutant) motifs in each of two ECDs in homophilic trans interaction. (B) Confocal spinning-disk images of live Tg(cspg4:GAL4; UAS:pcdh18a-ECDREDV or AEAV-GFP; kdrl:ras-mCherry) embryos in the CVP at 50 hpf. (Ba-Bd) Pcdh18a-ECDREDV-GFP expressing reticular (Ba,Bb) or perivascular (Bc,Bd) stromal cells (green) overlaid on endothelial cells (red). Dashed lines indicate the border of each SPvC. (Be-Bh) Pcdh18a-ECDAEAV-GFP expressing reticular (Be,Bf) or perivascular (Bg,Bh) stromal cells (green) overlaid on endothelial cells (red). GFP+ SPvCs typically showed only partial adherence to the endothelium. Arrows indicate GFP+ reticular (Bb,Bf) and perivascular (Bd,Bh) cells, respectively. Scale bars: 10 µm. (C) Histogram showing the percentage of reticular versus perivascular cells among pcdh18a-ECDAEAV-GFP- or pcdh18a-ECDREDV-GFP-expressing stromal cells at 50 hpf. n=10 embryos per condition, from a single experiment (mean±s.d.; ****P<0.0001; unpaired, two-tailed Student's t-test). |