
- Title
-
Comparative Transcriptome Analysis Provides Novel Molecular Events for the Differentiation and Maturation of Hepatocytes during the Liver Development of Zebrafish
- Authors
- Zhao, Y., Li, X., Song, G., Li, Q., Yan, H., Cui, Z.
- Source
- Full text @ Biomedicines
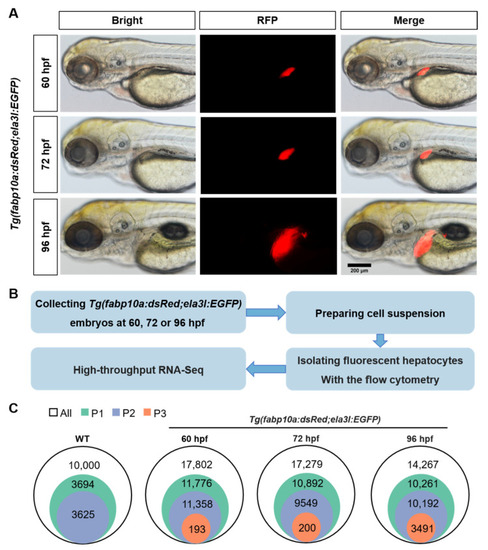
The isolation of zebrafish hepatocytes. (A) The size changes of red-fluorescent liver at 60, 72, and 96 hpf in transgenic zebrafish Tg(fabp10a:dsRed;ela3l:EGFP). Scale bar, 200 μm. (B) The technical roadmap for isolation of zebrafish hepatocytes. (C)The cell populations of hepatocytes sorted from Tg(fabp10a:dsRed;ela3l:EGFP) embryos at 60, 72 and 96 hpf. |
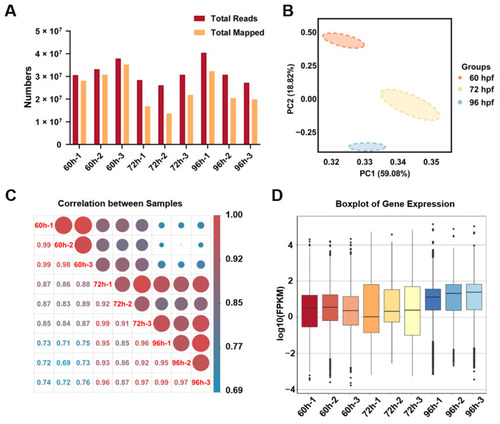
The quality analysis of transcriptome data for zebrafish hepatocytes. (A) The RNA-seq data of sorted liver cells at three time points. (B) The principal component analysis (PCA) of samples at three time points. (C) The Pearson’s correlation coefficient matrix of RNA-seq between samples at three time points. (D) The boxplots of gene expression in samples at three time points. |

The differentially expressed genes analysis in early liver developmental stages. (A) Statistics of differentially expressed genes (DEGs) in hepatocytes between two time points. (B) The Venn diagram analysis of DEGs in hepatocytes among three time points. Heatmaps of DEGs between two time points, including 60 and 72 hpf (C), 60 and 96 hpf (D), as well as 72 and 96 hpf (E). |

GO enrichment analysis of genes specifically expressed during different time periods of liver development. (A) The Venn diagram analysis of differentially expressed genes. a-g: different letters represent genes specifically expressed in different Venn groups. (B) GO enrichment analysis of genes specifically expressed in groups a and b that represent a class of genes specifically expressed in hepatocytes from 60 to 72 hpf. (C) GO enrichment analysis of genes specifically expressed in groups f and g that represent a class of genes specifically expressed in hepatocytes from 72 to 96 hpf. (D) GO enrichment analysis of genes specifically expressed in groups c, f, and g that represent all differentially expressed genes in hepatocytes between 60–72 hpf and 72–96 hpf. |

Hub signaling pathways from KEGG enrichment analysis of genes specifically expressed in hepatocytes at different stages. Dot plots of KEGG signaling pathways (A) and networks of top 10 hub pathways (B) for genes specifically expressed from 60 to 72 hpf (a and b). Dot plots of KEGG signaling pathways (C) and networks of top 10 hub pathways (D) for genes specifically expressed from 72 to 96 hpf (f and g). Dot plots of KEGG signaling pathways (E) and networks of top 10 hub pathways (F) for genes specifically expressed from 60 to 96 hpf (c, f and g). Node color stands for the enrichment p-value in the pathway. |
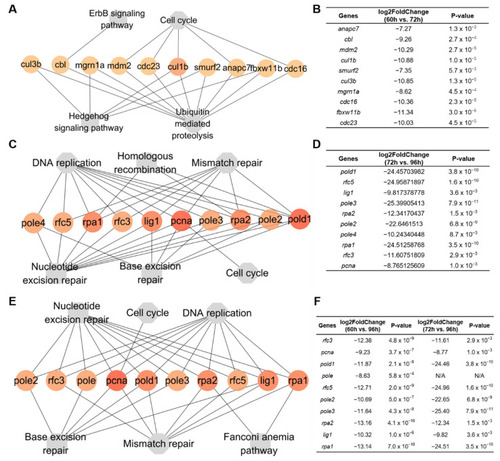
Hub genes within KEGG pathways. (A) Networks of 10 hub genes mapped to top four pathways in groups a and b from 60 to 72 hpf. (B) The fold changes of hub genes in groups a and b. (C) Networks of 10 hub genes mapped to top 6 pathways from 72 to 96 hpf in groups f and g. (D) The fold changes of hub genes in groups f and g. (E) Networks of 10 hub genes mapped to top 6 pathways from 60 to 96 hpf in groups c, f, and g. (F) The fold changes of hub genes in groups c, f, and g. |

Dynamic changes of DEGs in hepatocytes from 60 to 96 hpf (A) Hierarchical clustering of changes in DEGs. (B) Functional annotations of different clusters by GO analysis. Heatmaps of biological processes were displayed according to their statistical significance (p < 0.05) and locations in the GO tree. |