
- Title
-
Computational Modeling of Motile Cilia-Driven Cerebrospinal Flow in the Brain Ventricles of Zebrafish Embryo
- Authors
- Salman, H.E., Jurisch-Yaksi, N., Yalcin, H.C.
- Source
- Full text @ Bioengineering (Basel)

Figure 1. (a) The schematic of a brain ventricle for a 2 dpf zebrafish embryo. The blue arrow shows the flow direction. DV: Di-/mesencephalic ventricle. The green highlight indicates the location of motile cilia. (b) The averaged cyclic motion of one motile cilium. The color of the lines from light to dark reflects the progression of time in the cyclic motion. The red line shows the spatial mean of the cyclic motion and has an angle of 30 degrees with the Y-axis. The total time length of one cyclic motion was 0.033 s.
|

Figure 2. (a) Definition of cilium tilt angle. The cilia are connected to the ground and the connection point is stationary during the ciliary beating. (b) The dimensions of the flow domain are used as 25 µm × 50 µm. The red line is the ground of the flow domain, which is modeled as a wall with no-slip condition. A non-zero mass flow rate is observed on the yellow line depending on the ciliary motion. (c) The geometric configuration of two cilia with no phase difference (Case 4, in phase). (d) The geometric configuration of two cilia with phase difference (Case 5, out of phase). For the out of phase configuration, the cilium at the right side completes its cycle, while the cilium at the left is at half of the cyclic motion.
|
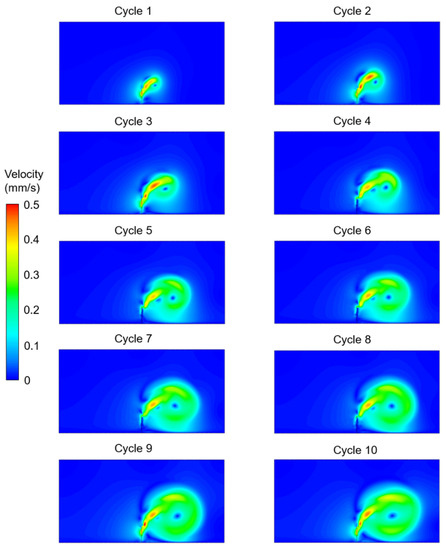
Figure 3. Velocity contour plots of Case 1 for a single cilium with a 30° cilium tilt angle. The flow fields are provided at the end of each ciliary cycle.
|

Figure 4. Velocity contour plots of Case 2 for a single cilium with a 50° cilium tilt angle. The flow fields are provided at the end of each ciliary cycle.
|
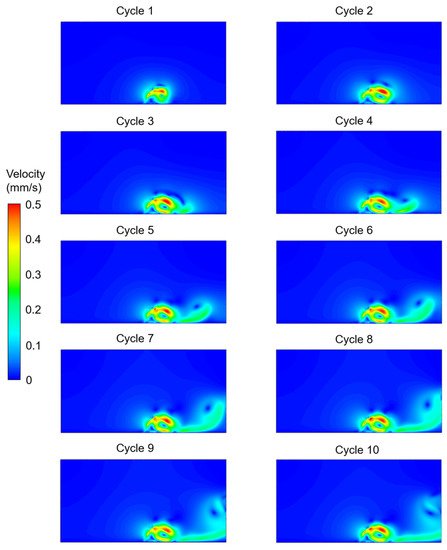
Figure 5. Velocity contour plots of Case 3 for a single cilium with a 60° cilium tilt angle. The flow fields are provided at the end of each ciliary cycle.
|
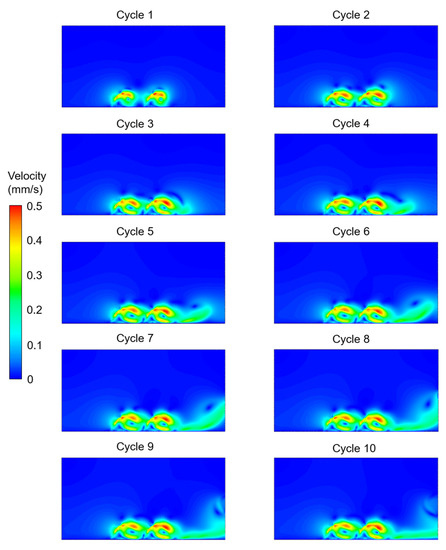
Figure 6. Velocity contour plots of Case 4 for two cilia with a 60° cilium tilt angle. The cilia beat synchronously (in phase) without any phase difference in time. The flow fields are provided at the end of each ciliary cycle.
|

Figure 7. Velocity contour plots of Case 5 for two cilia with a 60° cilium tilt angle. The cilia beat with a phase difference (out of phase). One of the cilia completes the cyclic motion when the other one is at half of the cyclic movement. The flow fields are provided at the end of each ciliary cycle.
|

Figure 8. Mass flow rates at the right-side line of the flow domain for various tilt angles and cilia formations. The average mass flow rates are shown in the top figure, which uses ten different colors to represent ten consecutive cyclic ciliary beatings. In the bottom figure, the average and maximum mass flow rates during ten consecutive ciliary beatings are presented.
|