
Image
|
Figure Caption
Fig. 8
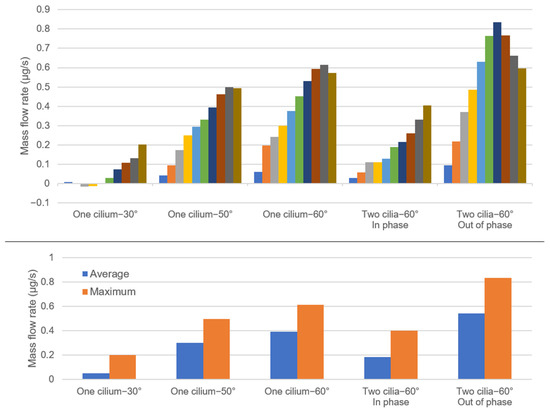
Figure 8. Mass flow rates at the right-side line of the flow domain for various tilt angles and cilia formations. The average mass flow rates are shown in the top figure, which uses ten different colors to represent ten consecutive cyclic ciliary beatings. In the bottom figure, the average and maximum mass flow rates during ten consecutive ciliary beatings are presented.
Acknowledgments
This image is the copyrighted work of the attributed author or publisher, and
ZFIN has permission only to display this image to its users.
Additional permissions should be obtained from the applicable author or publisher of the image.
Full text @ Bioengineering (Basel)