FIGURE SUMMARY
Title

Arabinogalactan enhances Mycobacterium marinum virulence by suppressing host innate immune responses

Authors
Li, Y.Y., Liu, H.M., Wang, D., Lu, Y., Ding, C., Zhou, L.S., Wu, X.Y., Zhou, Z.W., Xu, S.Q., Lin, C., Qin, L.H., Li, Y., Liu, J., Liu, H.P., Zhang, L.
Source
Full text @ Front Immunol

Construction of conditional EmbA/GlfT2_KD strains and validation of impaired arabinogalactan synthesis in Mycobacterium marinum cell wall. (A) qPCR proved the corresponding relative expression of embA or glfT2 of embA knock-down (EmbA_KD) or glfT2 knock-down (GlfT2_KD) strains with or without anhydrotetracycline (ATc) induction at logarithmic growth stage. Data are plotted as mean ± standard deviation (SD), unpaired t-test: ****p < 0.0001, *p = 0.0236. (B, C) Growth curves of EmbA/GlfT2_KD strain with or without ATc induction. Absorbance (OD600) measured in the bacterial liquid reflects the growth. (D) High-performance gel permeation chromatography was used to analyze the polysaccharide molecular weights of knock-down strain cell walls. The linear regression equation of retention time (tR) and relative molecular weight (MW) of polysaccharide is logMW = -0.5042 tR + 11.884. Relative molecular weights corresponding to peaks are marked. (E) High-performance liquid chromatography was used to analyze the monosaccharide contents in the cell walls of control and knock-down strains. The peak area integral was used to calculate the proportion of each monosaccharide, and the ratios of arabinose–galactose/mannose or galactose/arabinose were calculated. The calculation results are presented in the table.

Cell wall structure of knock-down strains in the scanning electron microscopy (SEM) and transmission electron microscopy (TEM) fields. (A) The control PLJR962 strain and EmbA/GlfT2_KD strains were observed by SEM at ×10,000 and ×100,000 magnification. The red arrow indicates the extracellular material around the bacteria. (B) TEM observation of the control PLJR962 strain and EmbA/GlfT2_KD strains at ×100,000 magnification and partial enlargement of the cell wall. The red arrows indicate the outer layer (OL), electron transparent layer (ETL), and peptidoglycan layer (PGL). (C) A unified scale is used to measure the thickness of OL, ETL, and PGL layers of each strain from (B) in all visual fields by Image J software. The cell walls of three bacteria in each visual field were taken for measurement. Data are plotted as mean ± SD, unpaired t-test: **P < 0.01, ***P < 0.001, and ****P < 0.0001. (D) The diameters of plaques were measured on 7H9 agar plate at timepoints of 4/7/9/11 days to reflect the biofilm formation. The plaques on day 11 are shown in the upper figure. A total of three parallel plates were used for significance analysis using unpaired t-test: *P < 0.05 and ***P < 0.001.

EmbA/GlfT2_KD strain-infected murine macrophage J774A.1 line. (A, B) Macrophages were infected with a multiplicity of infection (MOI) = 1 at 48-h timepoints, and cell survival rates were determined using the cell counting kit (CCK8) at 24/48 h. The cell survival rate was calculated as follows: survival rate = [(As - Ab)/(Ac - Ab)] × 100%, in which As is the absorbance of the infected well of the control of knock-down groups, Ab is the absorbance of medium-only well without added cells, and Ac is the absorbance of uninfected cell wells. (C, D) The macrophages were infected with a MOI = 5 at 48-h timepoints, and the cell survival rate was determined by CCK8 at 24/48 h. (A–D) Data processing is homogenized, and data are plotted as mean ± SD. Two-way ANOVA tests are used for all significance analysis here: **P < 0.01, **P < 0.01, ***P < 0.001, and ****P < 0.0001.

Zebrafish infection model with EmbA/GlfT2_KD strains. (A, B) Survival curves of larvae zebrafish infected by control PLJR962 strain and EmbA/GlfT2_KD strains with initial colony forming unit (CFU) = 100 or 300, respectively (n = 20–50). Log-rank tests are used to test the significance of the Kaplan–Meier survival curves: *P < 0.05, **P < 0.01. (C, D) CFU counts and the granuloma numbers in adult zebrafish infected by control strain and EmbA/GlfT2 knock-down strains, respectively, at 2 weeks post-injection. Data were plotted as mean ± SD. Two-way analysis of variance tests were used for all significance analysis: *P < 0.05 and **P < 0.01. (E) Acid-fast staining and hematoxylin and eosin (H&E) staining of zebrafish sections. Acid-fast staining was observed with an optical microscope at ×100 and ×200, and the visual field of H&E stain was the corresponding area of acid-fast staining at ×200 magnification. The red arrow points to the granuloma, and the purplish red color in the center of acid-fast granuloma represents the thallus.

Murine tail infection model with EmbA/GlfT2_KD strains. (A) Tail ulcer formation in mice injected with control PLJR962 strain and EmbA/GlfT2_KD strains within 1 week post-injection. (B) Pathological H&E staining in mice ulcer. With distinguishable tail tissue cells, most of the clustered purple nuclei belong to lymphocytes.

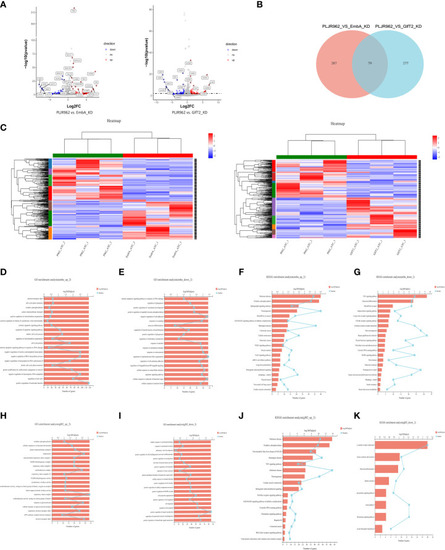
Transcriptome analysis of EmbA/GlfT2_KD strain-infected murine macrophage line J774A.1 (MOI = 5, 12 h). (A) Volcanic map of the differential quality of differentially expressed genes (DEGs). The abscissa is the multiple of the gene/transcript expression difference between the two samples, and the ordinate is the statistical test value of gene expression difference. A larger -log10 (p-value) indicates a more significant difference in expression. The values of horizontal and vertical coordinates were logarithmically processed. Each dot represents a specific gene. The software edgeR was used for DEG analysis, and the screening threshold was |log2FC| ≥ 1 and the p-value was <0.05. (B, C) Venn diagram and clustering heat map of DEGs in the two groups of knock-down strains compared with the control group, and there are 10 subclusters in both groups. Each column represents a sample, and each row represents a gene. The color in the figure denotes the expression level of the gene after a standardized treatment in each sample; red indicates a high expression level, while blue means a low expression level. On the left side of the heat map is the tree diagram of gene sub-clustering, and on the right side is the name of the genes. The upper part represents the tree of sample clustering. The closer the branches of the two samples are, the closer the variation trends of the gene expression levels are. (D, E) Gene ontology (GO) enrichment analysis of genes up/downregulated in macrophages infected with the EmbA_KD strain. The ordinate represents the GO term, and the lower abscissa represents the number of genes/transcripts compared to the GO term, corresponding to different points on the broken line. The upper horizontal coordinate represents the significance level of enrichment, corresponding to the height of the column. A smaller p-value (adjusted) indicates a larger value of −log10 (p-adjusted); thus, the more significant it is means that the GO term is enriched. (F, G) Kyoto Encyclopedia of Genes and Genomes (KEGG) pathway enrichment analysis of genes up/downregulated in macrophages infected with EmbA_KD strain. The vertical axis represents the KEGG pathway, and the horizontal axis represents the number of genes/transcripts compared to this pathway, corresponding to the different points on the broken line. The upper horizontal coordinate represents the significance level of enrichment, which corresponds to the height of the column. A smaller false discovery rate means a larger −log10 (p-adjusted) value and a more significantly enriched KEGG pathway. (H, I) GO enrichment analysis of genes up/downregulated in macrophages infected with the GlfT2_KD strain. (J, K) KEGG pathway enrichment analysis of genes up/downregulated in macrophages infected with the GlfT2_KD strain.

Validation of cebpb expression and secreted regulatory cytokine levels in an infected macrophage. (A) Real-time polymerase chain reaction was used to verify the mRNA expression level of cepbp in the corresponding sample of transcriptomes (from macrophages infected with multiplicity of infection = 5 and 12 h). Data were plotted as mean ± SD, unpaired t-test: *p = 0.0465 and **P = 0.0018. (B) Cytokine contents in the cell supernatant of macrophage J774A.1 infected by control PLJR962 strain and EmbA_KD strain with MOI = 5. Two-way ANOVA tests are used for all significance analysis here: **P < 0.01, **P < 0.01, ***P < 0.001, and ****P < 0.0001.

Acknowledgments
This image is the copyrighted work of the attributed author or publisher, and ZFIN has permission only to display this image to its users. Additional permissions should be obtained from the applicable author or publisher of the image. Full text @ Front Immunol