IMAGE

Figure 6

ID
ZDB-IMAGE-220914-19
Source
Figures for Li et al., 2022
Image
Figure Caption

Figure 6

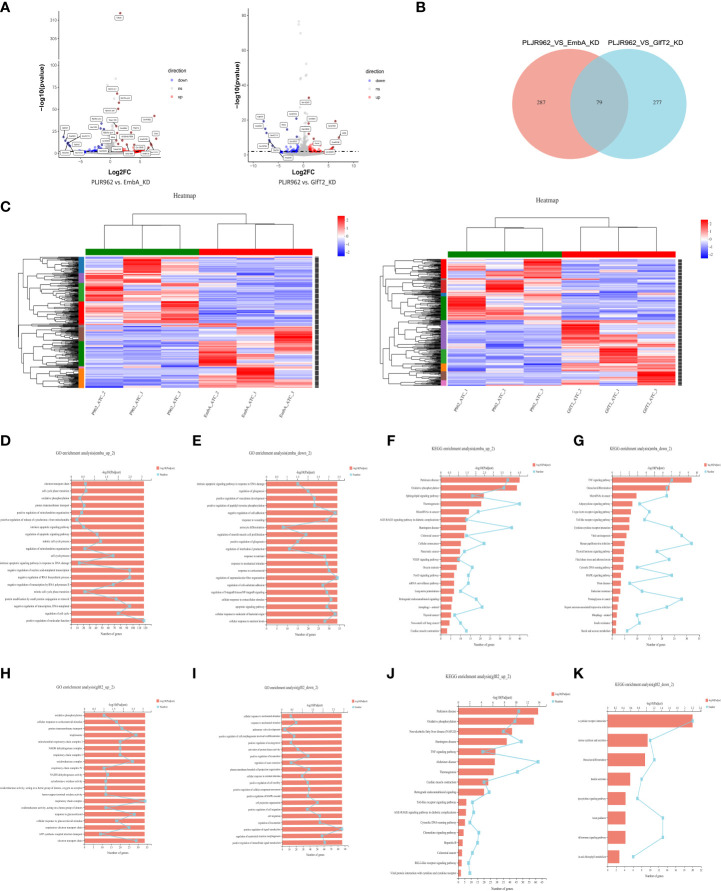
Transcriptome analysis of EmbA/GlfT2_KD strain-infected murine macrophage line J774A.1 (MOI = 5, 12 h). (A) Volcanic map of the differential quality of differentially expressed genes (DEGs). The abscissa is the multiple of the gene/transcript expression difference between the two samples, and the ordinate is the statistical test value of gene expression difference. A larger -log10 (p-value) indicates a more significant difference in expression. The values of horizontal and vertical coordinates were logarithmically processed. Each dot represents a specific gene. The software edgeR was used for DEG analysis, and the screening threshold was |log2FC| ≥ 1 and the p-value was <0.05. (B, C) Venn diagram and clustering heat map of DEGs in the two groups of knock-down strains compared with the control group, and there are 10 subclusters in both groups. Each column represents a sample, and each row represents a gene. The color in the figure denotes the expression level of the gene after a standardized treatment in each sample; red indicates a high expression level, while blue means a low expression level. On the left side of the heat map is the tree diagram of gene sub-clustering, and on the right side is the name of the genes. The upper part represents the tree of sample clustering. The closer the branches of the two samples are, the closer the variation trends of the gene expression levels are. (D, E) Gene ontology (GO) enrichment analysis of genes up/downregulated in macrophages infected with the EmbA_KD strain. The ordinate represents the GO term, and the lower abscissa represents the number of genes/transcripts compared to the GO term, corresponding to different points on the broken line. The upper horizontal coordinate represents the significance level of enrichment, corresponding to the height of the column. A smaller p-value (adjusted) indicates a larger value of −log10 (p-adjusted); thus, the more significant it is means that the GO term is enriched. (F, G) Kyoto Encyclopedia of Genes and Genomes (KEGG) pathway enrichment analysis of genes up/downregulated in macrophages infected with EmbA_KD strain. The vertical axis represents the KEGG pathway, and the horizontal axis represents the number of genes/transcripts compared to this pathway, corresponding to the different points on the broken line. The upper horizontal coordinate represents the significance level of enrichment, which corresponds to the height of the column. A smaller false discovery rate means a larger −log10 (p-adjusted) value and a more significantly enriched KEGG pathway. (H, I) GO enrichment analysis of genes up/downregulated in macrophages infected with the GlfT2_KD strain. (J, K) KEGG pathway enrichment analysis of genes up/downregulated in macrophages infected with the GlfT2_KD strain.

Acknowledgments
This image is the copyrighted work of the attributed author or publisher, and ZFIN has permission only to display this image to its users. Additional permissions should be obtained from the applicable author or publisher of the image. Full text @ Front Immunol