
- Title
-
Voltage-sensing phosphatase (Vsp) regulates endocytosis-dependent nutrient absorption in chordate enterocytes
- Authors
- Ratanayotha, A., Matsuda, M., Kimura, Y., Takenaga, F., Mizuno, T., Hossain, M.I., Higashijima, S.I., Kawai, T., Ogasawara, M., Okamura, Y.
- Source
- Full text @ Commun Biol
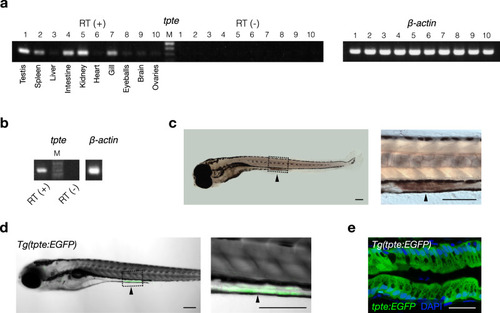
Expression profile of the Dr-Vsp-encoding gene (tpte) in zebrafish tissues.
a RT (+), tpte expression in adult zebrafish tissues: (1) testis, (2) spleen, (3) liver, (4) intestine, (5) kidney, (6) heart, (7) gill, (8) eyeballs, (9) brain, and (10) ovaries. RT (−), negative control for all tissues in the same order. β-actin, positive control. M, marker. b RT (+), tpte expression in 7-dpf zebrafish larva. RT (−), negative control. β-actin, positive control. M, marker. c Whole-mount in situ hybridization (WISH) of 6-dpf zebrafish larva showing tpte-positive signal (arrowhead) in enterocytes of mid-intestine. Scale bar = 200 µm. d A 5-dpf Tg(tpte:EGFP) zebrafish larva expressing EGFP under the promotor of the Dr-Vsp-encoding gene in enterocytes of mid-intestine (arrowhead). The EGFP-positive cells in this figure correspond to the tpte-positive cells in c. Green, Dr-Vsp (tpte:EGFP). Scale bar = 200 µm. e Confocal image of larval enterocytes at mid-intestine of a 5-dpf Tg(tpte:EGFP) zebrafish larva (sagittal section). The enterocytes in this region are known as lysosome-rich enterocytes (LREs) that contain large supranuclear vacuoles. Green, Dr-Vsp (tpte:EGFP). Blue, DAPI. Scale bar = 25 µm. |
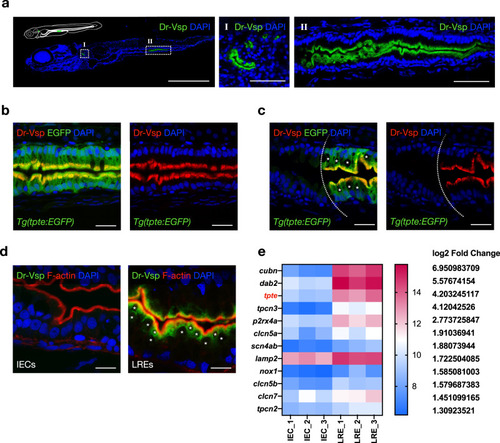
Expression profile of Dr-Vsp protein in zebrafish tissues.
a Confocal images of Dr-Vsp immunostaining in a 7-dpf wild-type zebrafish larva (sagittal section). Dr-Vsp is highly expressed in (I) larval pronephros and (II) enterocytes at the posterior part of the mid-intestine, which are defined as lysosome-rich enterocytes (LREs). Green, Dr-Vsp. Blue, DAPI. Scale bar = 500 µm (left) and 50 µm (middle and right). b Dr-Vsp immunostaining in LREs of a 7-dpf Tg(tpte:EGFP) transgenic zebrafish larva (sagittal section). Dr-Vsp expression signals were completely colocalized with EGFP signals in LREs. Green, Dr-Vsp (tpte:EGFP). Red, Dr-Vsp (antibody). Blue, DAPI. Scale bar = 20 µm. c Dr-Vsp immunostaining in a 7-dpf Tg(tpte:EGFP) transgenic zebrafish larva (sagittal section), showing a border between intestinal epithelial cells (IECs; Vsp-negative) and LREs (Vsp-positive). LREs contain large supranuclear vacuoles in the cytoplasm, contrasting with IECs. Green, Dr-Vsp (tpte:EGFP). Red, Dr-Vsp (antibody). Blue, DAPI. Scale bar = 20 µm. The background signal of the EGFP channel was increased in the left figure to enhance the visibility of IECs. d Dr-Vsp immunostaining in IECs (left) and LREs (right) of a 7-dpf wild-type zebrafish larva (sagittal section). Dr-Vsp expression was restricted mainly to LREs, but not detectable in other IECs. Green, Dr-Vsp. Red, F-actin. Blue, DAPI. Scale bar = 10 µm. Images were visualized under an LSM880 confocal microscope with AiryScan. e Heatmap of RNA-seq data representing expression levels of selected genes in IECs and LREs. Raw data of RNA-seq experiments were retrieved from the GEO Datasets database with accession number {"type":"entrez-geo","attrs":{"text":"GSE124970","term_id":"124970"}}GSE124970 contributed by ref. 23 and analyzed using the web-based application iDEP v0.9269. EXPRESSION / LABELING:
|
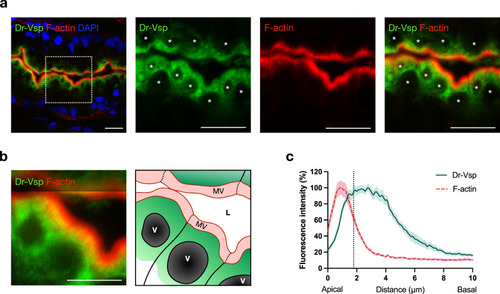
Expression profile of Dr-Vsp protein at the subapical region of LREs.
a Confocal images of Dr-Vsp immunostaining showing the subcellular distribution of Dr-Vsp in larval LREs. Dr-Vsp is primarily localized in the cytoplasm underneath the apical surface but barely detectable at the microvilli and plasma membrane of LREs. Green, Dr-Vsp. Red, F-actin, Blue, DAPI. *Vacuole. Scale bar = 10 µm. b Confocal image of larval LREs at higher magnification and their corresponding schematic illustrations, focusing on the intracellular distribution of Dr-Vsp. Green, Dr-Vsp. Red, F-actin. V vacuole, MV microvilli, L lumen. Scale bar = 5 µm. c Fluorescence intensity of Dr-Vsp (green) and F-actin (red) along the apicobasal axis of individual LREs. Data were presented as mean ± SEM. Enterocytes = 16 cells from 4 larvae for each zebrafish line. The dotted line in the graph conceptually indicates the junction between the microvilli and the cell body. EXPRESSION / LABELING:
|
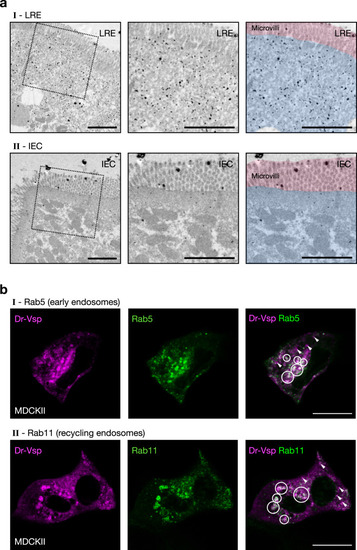
Expression profile of Dr-Vsp protein at endomembranes.
a Pre-embedding silver-enhanced immunogold staining for Dr-Vsp in (I) LREs and (II) IECs of 14-dpf wild-type zebrafish larva. The right two images are the same as the middle images but were highlighted with red and blue for microvilli and subapical region, respectively. In LREs, immunoparticles for Dr-Vsp are preferentially distributed at the subapical region while rarely detectable at microvilli, consistent with results of Dr-Vsp immunofluorescence in Fig. 3. In IECs, immunoparticles for Dr-Vsp are rarely detectable at both subapical region and microvilli, consistent with Dr-Vsp immunofluorescence and RNA-seq analysis in Fig. 2. Scale bar = 2 µm. b MDCKII cells co-expressing Dr-Vsp-mCherry and (I) Rab5-EGFP for early endosomes; or (II) Rab11-EGFP for recycling endosomes. Colocalized fluorescent signals (circles) represent Dr-Vsp expression at the endosomal membranes of early and recycling endosomes. Note that non-colocalized Dr-Vsp signals (arrowheads) are also present in both images. Magenta, Dr-Vsp. Green, Rab5 or Rab11. Scale bar = 20 µm. EXPRESSION / LABELING:
|

Phenotypic investigation of Dr-Vsp−/− zebrafish.
a Survival rates of wild-type and Dr-Vsp−/− zebrafish larvae during the first month of age. Zebrafish larvae, 300 at D0 for each zebrafish line. All statistical data were collected from three independent experiments. b Body length of wild-type and Dr-Vsp−/− zebrafish larvae raised under a non-calorie-restricted standard diet. Zebrafish larvae on the first day (D0) is 45 for wild-type and 44 for Dr-Vsp−/− zebrafish. Error bars, means ± SD; *P < 0.05; **P < 0.01; unpaired Student’s t-test. c Brightfield images of the representative wild-type (WT) and Dr-Vsp−/− zebrafish larvae at 28 dpf, raised under the same conditions. Scale bar = 1 mm. PHENOTYPE:
|
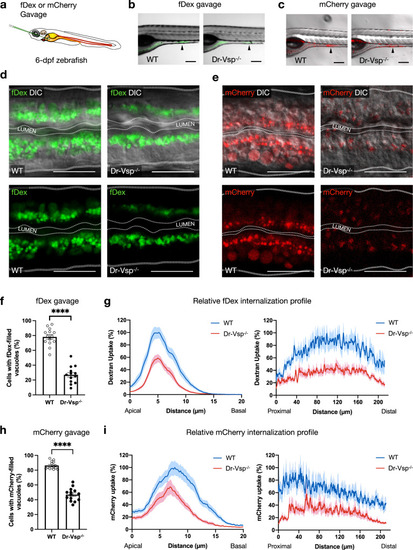
Functional analysis of Dr-Vsp in larval enterocytes.
a Experimental approach: 6-dpf zebrafish larvae were gavaged with Alexa FluorTM 488-tagged dextran (fDex) or mCherry solutions into the anterior intestinal bulb. Live imaging was performed at 2 h after gavage. b–e fDex and mCherry internalized into zebrafish LREs after gavage. b Live confocal images of wild-type (WT) and Dr-Vsp−/− zebrafish larvae showing fDex internalization in enterocytes at the posterior portion of mid-intestine (arrowhead). Scale bar = 200 µm. c Live confocal images of wild-type and Dr-Vsp−/− zebrafish larvae showing mCherry internalization in enterocytes at the posterior portion of mid-intestine (arrowhead). Scale bar = 200 µm. d Live confocal images of wild-type and Dr-Vsp−/− enterocytes showing fDex internalization. The images were presented with DIC (top) or without DIC (bottom) to enhance the visibility of the internalized fDex. Dotted lines conceptually indicate the outlines of larval intestines. Scale bar = 20 µm. e Live confocal images of wild-type and Dr-Vsp−/− enterocytes showing mCherry internalization. The images were presented with DIC (top) or without DIC (bottom) to enhance the visibility of the internalized mCherry. Dotted lines conceptually indicate the outlines of larval intestines. Scale bar = 20 µm. f, g Endocytosis efficiency analysis in LREs after fDex gavage. f Percentage of the enterocytes containing fDex-filled vacuoles at 2 h following gavage, representing the proportion of cells capable of internalizing fDex and forming subsequent endosomal vacuoles. Error bars, means ± SEM; ****P < 0.0001; unpaired Student’s t-test. Number of enterocytes = 344 cells from 14 wild-type and 359 cells from 13 Dr-Vsp−/− zebrafish. g Relative fDex internalization profile comparing between wild-type and Dr-Vsp−/− zebrafish larvae at 2 h following gavage. Data were means ± SEM percentage of intracellular fDex intensity along the specified axes, with 100% indicating the maximal value of the average intensity on each axis. (Left) Apicobasal axis of individual cells. (Right) Longitudinal axis along the posterior portion of mid-intestine. Number of fish = 14 for wild-type and 13 for Dr-Vsp−/−. Data were presented as mean ± SEM, collected from four independent experiments for both wild-type and Dr-Vsp−/−. h, i Endocytosis efficiency analysis in LREs after mCherry gavage. h Percentage of the enterocytes containing mCherry-filled vacuoles at 2 h following gavage, representing the proportion of cells capable of internalizing mCherry and forming large endosomal vacuoles. Error bars, means ± SEM; ****P < 0.0001; unpaired Student’s t-test. The number of enterocytes = 376 cells from 14 wild-type and 341 cells from 14 Dr-Vsp−/− zebrafish. i Relative mCherry internalization profile comparing between wild-type and Dr-Vsp−/− zebrafish larvae at 2 h following gavage. Data were means ± SEM percentage of intracellular mCherry intensity along the specified axes, with a 100% indicates the maximal value of the average intensity on each axis. (Left) Apicobasal axis of individual cells. (Right) Longitudinal axis along the posterior portion of mid-intestine. Number of fish = 14 for each zebrafish line. Data were presented as mean ± SEM, collected from four independent experiments for both wild-type and Dr-Vsp−/−. PHENOTYPE:
|
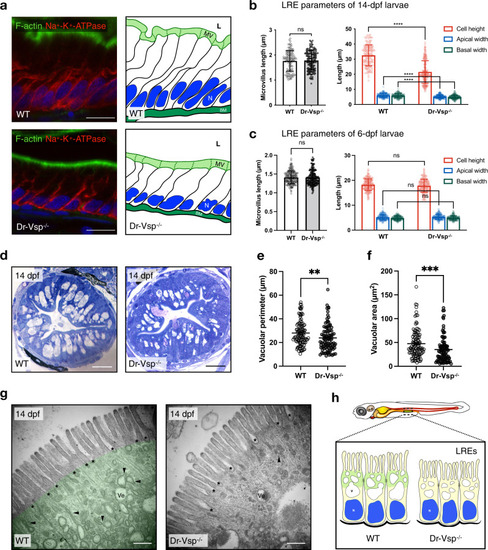
Morphological change in Dr-Vsp−/− LREs.
a Immunostaining showing cellular framework in sagittal sections of 14-dpf wild-type (WT) and Dr-Vsp−/− LREs; and their corresponding schematic illustration. Green, F-actin. Red, Na+-K+ ATPase. Blue, DAPI. Scale bar = 10 µm. b Cellular parameters of LREs at 14 dpf comparing wild-type and Dr-Vsp−/− zebrafish larvae. (Left) Microvillus length. (Right) Cell height, apical width, and basal width. Enterocytes, ≥120 cells from five larvae for each zebrafish line. c Cellular parameters of LREs at 6 dpf comparing wild-type and Dr-Vsp−/− zebrafish larvae. (Left) Microvillus length. (Right) Cell height, apical width, and basal width. Enterocytes, ≥170 cells from six larvae for each zebrafish line. Error bars, means ± SD; ****P < 0.0001; unpaired Student’s t-test; ns no statistically significant difference. d Representative transverse sections at mid-intestine of 14-dpf wild-type and Dr-Vsp−/− zebrafish larvae, showing LREs with intracellular supranuclear vacuoles. Sections were stained with toluidine blue. Scale bar = 20 µm. e, f Vacuole parameters of 14-dpf LREs. e Vacuolar perimeter of wild-type and Dr-Vsp−/− LREs. **P = 0.0024; Mann–Whitney U-test. Vacuoles, 108 for wild-type and 95 for Dr-Vsp−/−. Data were collected from three larvae for each zebrafish line. f Vacuolar area of wild-type and Dr-Vsp−/− LREs from the same samples as in Fig. 6e. ***P = 0.0003; Mann–Whitney U-test. g Representative TEM images at mid-intestine of 14-dpf wild-type and Dr-Vsp−/− zebrafish LREs, showing the ultrastructures of microvilli and subapical region. Key features of absorptive enterocytes are presented, including membrane invaginations at inter-microvillous spaces (*), cytoplasmic tubules and tubule-vacuole complexes (arrowhead), and numerous endocytic vesicles (Ve). In wild-type LRE, green represents the region upper to the supranuclear vacuole, which corresponds to the area with a positive immunofluorescence signal of Dr-Vsp in Fig. 3a, b. Scale bar = 500 nm. h Schematic diagram of wild-type and Dr-Vsp−/− LREs. Dr-Vsp (green) is primarily localized in the cytoplasm close to the apical surface of enterocytes, promoting endosomal maturation during endocytosis-dependent nutrient absorption. N nucleus, V vacuoles. EXPRESSION / LABELING:
PHENOTYPE:
|
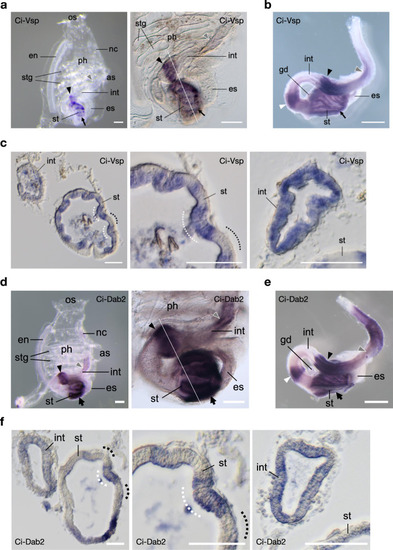
Expression profile of Ci-Vsp and Ci-Dab2 in ascidian C. intestinalis.
a–c Expression profile of Ci-Vsp by WISH. a Whole-mount (left) 2-week-old juvenile showing regional expressions in the stomach (st; arrow), bulged-region of the mid-intestine (int; arrowhead), and posterior-intestine (gray arrowhead). Higher magnification (right) reveals a stripe-like distribution of signals in the stomach and bulged intestine. b Dissected post-pharyngeal region of the digestive tract of the 1.5-month-old young adult showing an additional expression region (white arrowhead) in the looped-intestine. c Transverse section specimens of the juvenile (white line in a) showing Ci-Vsp expressions in the epithelium of the digestive tract (left). Expression signals in the stomach epithelium are restricted mainly in the inner-folds (white dotted lines), which contain several absorptive enterocytes38, as opposed to the outer-folds (dotted lines) with many pancreatic-related exocrine gene expressions39. Circumferences of the stomach (middle) and bulged intestine (right) show alternating epithelial morphology and Ci-Vsp expression. d–f Expression profile Ci-Dab2. d Whole-mount (left) 2-week-old juvenile showing regional expressions in the stomach (st; arrow), bulged-region of the mid-intestine (int; arrowhead), and posterior-intestine (gray arrowhead). Higher magnification (right) reveals a stripe-like distribution of signals in the stomach and bulged intestine. e Dissected post-pharyngeal region of the digestive tract of the 1.5-month-old young adult showing an additional expression region (white arrowhead) in the looped-intestine. f Transverse section specimens of the juvenile (white line in d) showing Ci-Dab2 expressions in the epithelium of the digestive tract (left). Expression signals in the stomach epithelium are restricted mainly in the inner-folds (white dotted lines) as opposed to the outer-folds (dotted lines). Circumferences of the stomach (middle) and bulged intestine (right) show alternating epithelial morphology and Ci-Dab2 expression. Scale bars = 200 µm in a, d, 1 mm in b, e, and 50 µm in c, f. OS oral siphon, AS atrial siphon, Ph pharynx, En endostyle, Stg stigma, Es esophagus, Nc neural complex, Gd gonad. |

Unillustrated author statements PHENOTYPE:
|