
- Title
-
Establishment of a Zebrafish Xenograft Model for in Vivo Investigation of Nasopharyngeal Carcinoma
- Authors
- Huang, E., Huang, H., Wu, L., Li, B., He, Z., Zhang, J.
- Source
- Full text @ Cell Transplant

Xenograft of human nasopharyngeal carcinoma CNE1 cells in zebrafish. (A) Expression of GFP after transfection was detected in the stabilized cell line of CNE1 cells. Scale bar: 50 μm. (B) Top: diagram of the establishment of zebrafish xenograft model. Bottom: experimental protocol. (C) Left: xenograft model of zebrafish at 1, 3, 5, and 7 dpt. Fluorescent and bright fields are merged, respectively. Scale bar: 1 mm. Right: the relative fluorescence intensity of tumor cells transplanted into zebrafish was quantified. The quantity of tumor cells at 1 dpt was used as the baseline, with which the quantity of tumor cells at other time points was compared. Data were quantitatively analyzed using one-way ANOVA (n = 4 fishes analyzed). Data are shown as mean ± SD. GFP: green fluorescent protein; PTU: phenylthiourea; dpt: days post-transplantation; dpf: days post-fertilization; NS: not significant. **P < 0.01; ****P < 0.0001. |
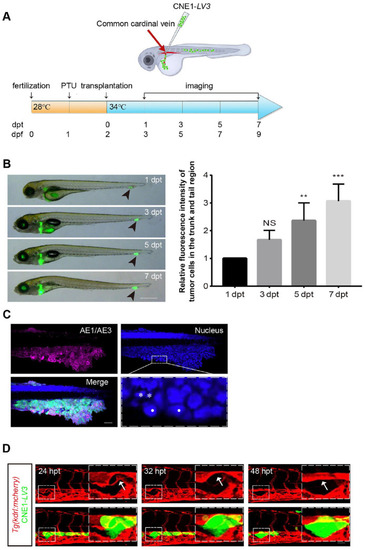
Transplantation of human NPC CNE1 cells into the CCV of zebrafish to observe the behavior of tumor cells. (A) Top: diagram of the establishment of zebrafish xenograft model. Bottom: experimental protocol. (B) Left: tumor cells transplanted into the circulatory system migrate to the tail region of zebrafish with blood flow and proliferated there. Black arrows indicate GFP-labeled tumor cells in the tail region. Scale bar: 3 mm. Right: the relative fluorescence intensity of tumor cells in zebrafish trunk and tail regions was quantified. The amount of tumor cells at 1 dpt was used as the baseline for comparison with that at other time points. Data were quantitatively analyzed by one-way ANOVA analysis (n = 4 fishes analyzed). (C) Zebrafish whole-mount immunofluorescence detection of the epithelial-derived tumor marker of AE1/AE3. Tumor cells that reached the tail region with blood flow were able to become tumorigenic in the zebrafish. Dashed line frames beneath are the high magnification of the region indicated. The nuclei of CNE1 cells are shown by white dots, and the nuclei of zebrafish are shown by white asterisks. The size of the nuclei of CNE1 cells is obviously larger than those of zebrafish. Scale bar: 50 μm. (D) Tumor cells were transplanted into the Tg(kdrl:mCherry) zebrafish circulatory system, and tumor cells migrated out from vessel lumen within 24–48 hpt in zebrafish tail. High magnifications of the regions (white dashed line) are shown on the right. White arrows point to the vessels (dorsal aorta) in the zebrafish. Scale bar: 50 μm. Data are shown as mean ± SD. NPC: Nasopharyngeal carcinoma; CCV: common cardinal vein; GFP: green fluorescent protein; PTU: phenylthiourea; dpt: days post-transplantation; dpf: days post-fertilization; hpt: hours post-transplantation; NS: not significant. **P < 0.01; ***P < 0.001. |

The expression of Cyclin D1 in tumor cells was reduced after knockdown of Pin1. (A) After transfection of LV3 control or shPin1 plasmids which express GFP as selecting marker, the CNE1-LV3 and CNE1-shPin1 cells were sorted first by FACS and imaged. Scale bar: 50 μm. (B) Western blot analysis was performed to detect the expression of Pin1 in tumor cells. The relative expression levels of Pin1 were quantified and the data were quantitatively analyzed by Student’s t test. Western blot (C) and immunofluorescence staining (D) of Cyclin D1 expression in CNE1 cells after knockdown of Pin1. Scale bar: 20 μm. Data were quantitatively analyzed using Student’s t test. Data are shown as mean ± SD. GFP: green fluorescent protein; FACS: fluorescence activating cell sorter. *P < 0.05; ***P < 0.001; ****P < 0.0001. |

Inhibition of Pin1 expression suppressed tumor cell proliferation in zebrafish. (A) Combined fluorescence and bright field images of zebrafish xenograft model transplanted with CNE1-LV3 or CNE1-shPin1 into the perivitelline space around the yolk sac at 1, 3, 5, and 7 dpt, respectively. The relative fluorescence intensity of the tumor cells in zebrafish was quantified. The amount of tumor cells at 1 dpt was used as the baseline with which the amount of tumor cells at other time points was compared. The differences in cell proliferation between the two groups were quantitatively analyzed by two-way ANOVA (CNE1-LV3 group, n = 6 transplanted fishes analyzed; CNE1-shPin1 group, n = 11 transplanted fishes analyzed). Scale bar: 1 mm. (B) Whole-mount embryo immunofluorescence staining of Pin1 and Cyclin D1 expression in zebrafish with tumor cells transplanted at 7 dpt. Selected areas of images (white dashed line) are shown with a higher magnification below. Scale bar: 50 μm; 10 μm in the amplified image. The mean fluorescence intensity of Pin1 and Cyclin D1 was quantitatively measured, and the data were quantitatively analyzed by Student’s t test (CNE1-LV3 group, n = 6 transplanted fishes analyzed; CNE1-shPin1 group, n = 4 transplanted fishes analyzed). Data are shown as mean ± SD. dpt: days post-transplantation; EGFP: enhanced green fluorescent protein. **P < 0.01; ***P < 0.001; ****P < 0.0001. |

The expression of ATF7 was correlated with the expression of Pin1. (A-B) Western blot analysis was used to detect the expression of ATF7 in Pin1-knockdown or Pin1-overexpressed CNE1 cells. The relative expression levels of Pin1 and ATF7 were quantified (n = 4 independent repeats). (C) Whole-mount embryo immunofluorescence staining of ATF7 expression in tumor cells transplanted in zebrafish. Images of selected areas (white dashed line) are shown at higher magnification below. Scale bar: 50 μm; 10 μm in the amplified image. The mean fluorescence intensity of Pin1 and ATF7 was analyzed quantitatively. The data were quantitatively analyzed by Student’s t test (CNE1-LV3 group, n = 5 transplanted fishes analyzed; CNE1-shPin1 group, n = 3 transplanted fishes analyzed). Data are shown as mean ± SD. GAPDH: glyceraldehyde-3-phosphate dehydrogenase; EGFP: enhanced green fluorescent protein. *P < 0.05; **P < 0.01; ***P < 0.001; ****P < 0.0001. |