
- Title
-
Ninjinyoeito improves social behavior disorder in neuropeptide Y deficient zebrafish
- Authors
- Kawabe, M., Nishida, T., Horita, C., Ikeda, A., Takahashi, R., Inui, A., Shiozaki, K.
- Source
- Full text @ Front Pharmacol

Effect of NYT on social behavior on mirror test in NPY-KO zebrafish. NPY-KO zebrafish were fed a control or NYT-diet twice daily for 4 days. Their social behaviors, such as interaction with the mirror and swimming distance, were estimated using a mirror test. (A) Mirror test apparatus. (B) Experimental scheme for behavioral evaluation. (C) Daily food intake. (D) Total distance traveled. (E) Tracking of control (left) and NYT-fed zebrafish (right) swimming behavior. (F) Total time for interaction with the mirror. (G) Total number of interactions with mirror. n = 8. Results are shown as mean ± standard error of the mean. n.s., not significant. |
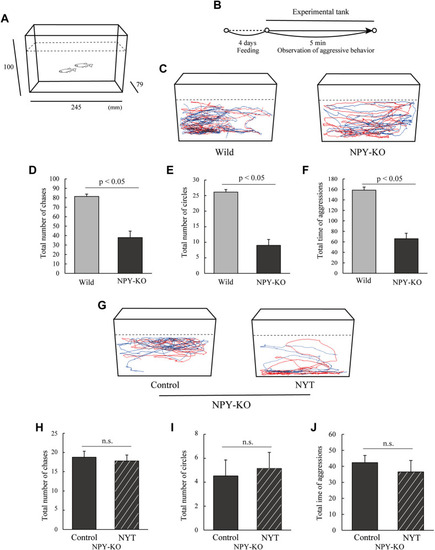
Effect of NYT on aggressive behavior in NPY-KO zebrafish. Wild and NPY-KO zebrafish were fed either control or NYT twice a day for 4 days. Two unfamiliar male zebrafish were set in an aquarium, and their aggressive behavior was analyzed. (A) Test apparatus. (B) Experimental scheme for behavioral evaluation. (C) Tracking of wild (left) and NPY-KO zebrafish (right) swimming behavior. (D) Total number of chases in the WT and NPY-KO zebrafish. (E) Total number of circles in the WT and NPY-KO zebrafish. Wild, n = 6; NPY-KO, n = 7. (F) Total time of aggression in wild and NPY-KO zebrafish. (G) Tracking of control (left) and NYT-fed (right) swimming behavior in NPY-KO zebrafish. (H) Total number of chases in control and NYT-fed NPY-KO zebrafish. (I) Total number of circles in control and NYT-fed NPY-KO zebrafish. (J) Total aggression time in control and NYT-fed NPY-KO zebrafish. n = 6. n.s., not significant. Results are shown as mean ± standard error of the mean. |
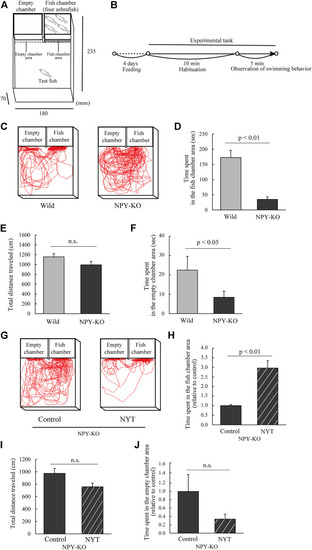
Effect of NYT on sociability in NPY-KO zebrafish. Wild and NPY-KO zebrafish were fed either control or NYT twice a day for 4 days. Sociability was analyzed using the 3-chambers test. (A) Test apparatus. (B) Experimental scheme for behavioral evaluation. (C) Tracking of wild (left) and NPY-KO zebrafish (right) swimming behavior. (D) Time spent in the fish chamber area in wild and NPY-KO zebrafish. (E) Total distance traveled in the WT and NPY-KO zebrafish. (F) Time spent in the empty chamber area of wild and NPY-KO zebrafish. Wild, n = 9; NPY-KO, n = 8. (G) Tracking of control (left) and NYT-fed (right) NPY-KO zebrafish swimming behavior. (H) Time spent in the fish chamber area of the control and NYT-fed NPY-KO zebrafish. (I) Total distance traveled by control and NYT-fed NPY-KO zebrafish. (J) Time spent in the empty chamber area in control and NYT-fed NPY-KO zebrafish. n = 8. Results are shown as mean ± standard error of the mean. n.s., not significant. |
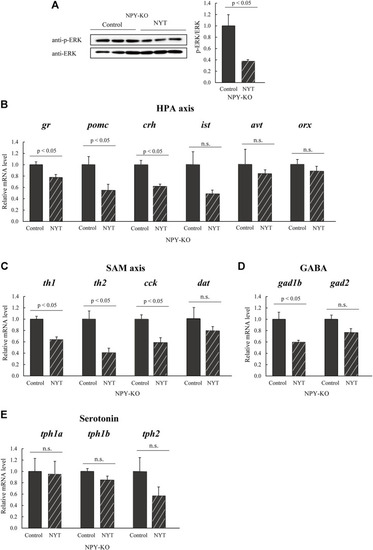
Effect of NYT on social behavior-related molecules in the NPY-KO zebrafish. The protein levels of (A) p-ERK were analyzed by immunoblotting with whole-brain lysate of the control—and NYT-fed NPY-KO zebrafish. The loading control used was (A) total ERK. n = 4. The mRNA levels of (B) HPA axis, (C) SAM axis, (D) GABA, and (E) serotonin-related genes were estimated by real-time PCR using whole brains of the control—and NYT-fed NPY-KO zebrafish. (B) HPA axis-related genes (gr, pomc, crh, ist, avt, and orx). (C) SAM axis-related genes (th1, th2, cck, and dat). (D) GABA-related genes (gad1b and gad2). (E) Serotonin-related genes (tph1a, tph1b, and tph2). The gene expression level of actb was used as an internal reference. Each gene expression level was relative to that in the control-fed NPY-KO zebrafish. n = 5. Results are shown as mean ± standard error of the mean. n.s., not significant. |
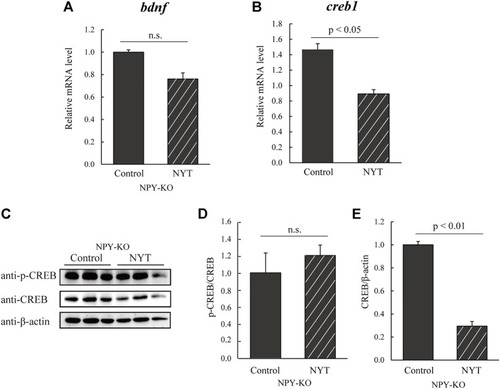
Effect of NYT on BDNF/CREB in NPY-KO zebrafish. The mRNA levels of bdnf and creb1 were estimated by real-time PCR using the whole brain of the control—and NYT-fed NPY-KO zebrafish. (A) bdnf. (B) creb1. The gene expression level of actb was used as an internal reference. Each gene expression level was relative to that in the control-fed NPY-KO zebrafish. n = 5. The protein levels of (C,D) p-CREB and (C,E) CREB were analyzed using immunoblotting with whole-brain lysates of control—and NYT-fed NPY-KO zebrafish. The loading control used was (D) total CREB and (E) β-actin. n = 4. Results are shown as mean ± standard error of the mean. n.s., not significant. |
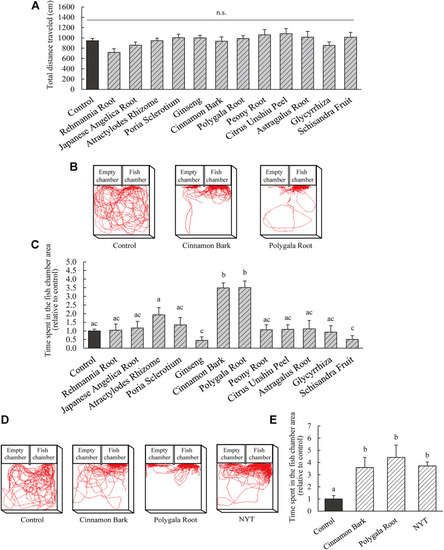
Evaluation of improvement of sociability in herbal medicine originating from NYT. (A–E) NPY-KO zebrafish were fed a control and herbal medicine diet twice a day for 4 days. Sociability was analyzed using the 3-chambers test. (A) Total distance traveled by control—and herbal medicine-fed NPY-KO zebrafish (equivalent to 3% NYT). (B) Tracking of control (left), Cinnamon Bark (middle), and Polygala Root-fed (right) swimming behavior. (C)Time spent in the control and herbal medicine-fed NPY-KO zebrafish in the fish chamber area. Control, n = 41; herbal medicines, n = 8. (D) Tracking of control (left), Cinnamon Bark (middle), and Polygala Root fed (middle), NYT (right) swimming behavior (equivalent to 0.3% NYT). (E) Time spent in the fish chamber area in control, Cinnamon Bark, Polygala Root, and NYT-fed NPY-KO zebrafish. Control n = 8; herbal medicines n = 7. Results are shown as mean ± standard error of the mean. There were significant differences between the different signs. n.s., not significant. |
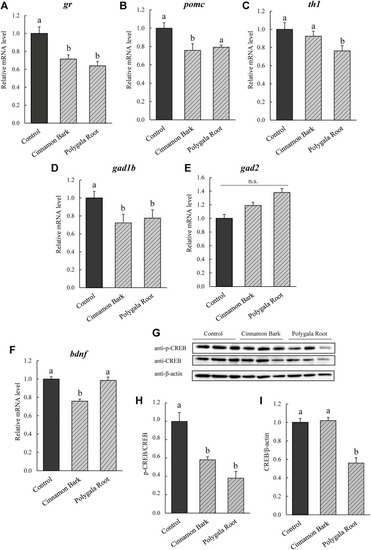
Effect of Cinnamon Bark and Polygala Root on BDNF/CREB in NPY-KO zebrafish. mRNA levels of the (A,B) HPA axis, (C) SAM axis, (D,E) GABA -related gene, and (F) bdnf were estimated by real-time PCR using whole brains of the control—and Cinnamon Bark -and Polygala Root-fed NPY-KO zebrafish. (A) gr. (B) pomc. (C) th1. (D) gad1d. (E) gad2. (F) bdnf. The gene expression level of actb was used as an internal reference. Each gene expression level was relative to that in the control-fed NPY-KO zebrafish. n = 5. The protein levels of (G,H) p-CREB and (G,I) CREB were analyzed by immunoblotting with whole-brain lysate of the control—and herbal medicine-fed NPY-KO zebrafish. A loading control was used as the (H) total CREB and (I) β-actin. n = 8. Results are shown as mean ± standard error of the mean. There were significant differences between the different signs. n.s., not significant. |