
Fig. 4
- ID
- ZDB-IMAGE-220831-67
- Publication
- Kawabe et al., 2022 - Ninjinyoeito improves social behavior disorder in neuropeptide Y deficient zebrafish
- All Figures
- Figures for Kawabe et al., 2022
|
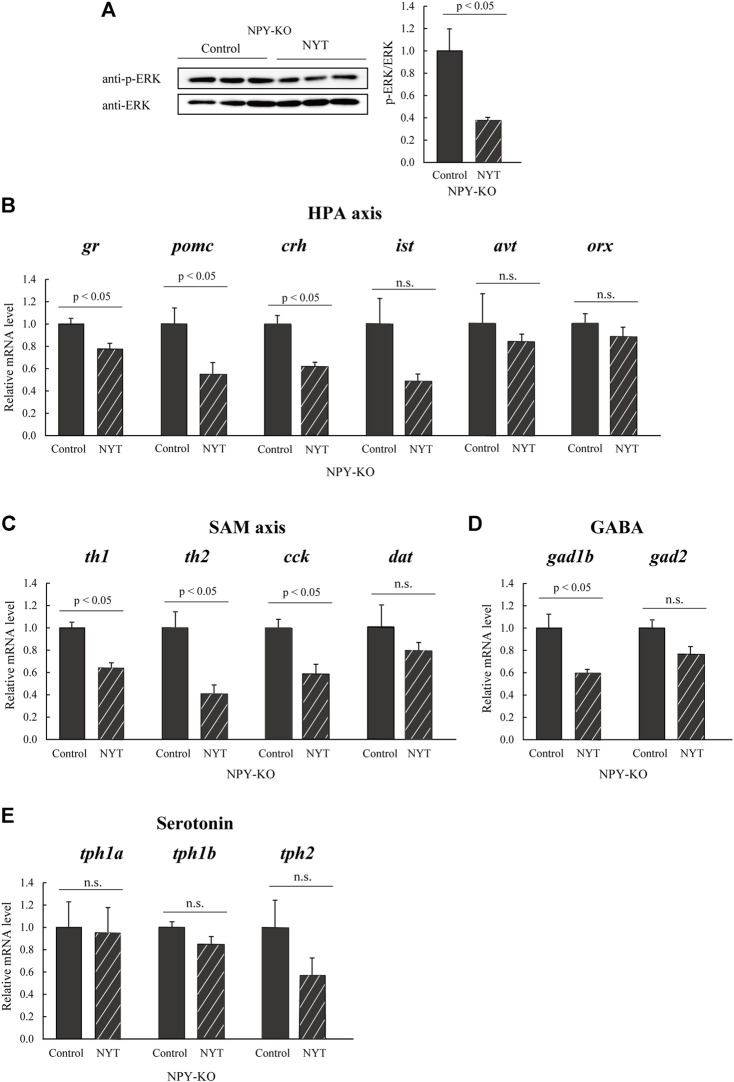
Fig. 4
Effect of NYT on social behavior-related molecules in the NPY-KO zebrafish. The protein levels of (A) p-ERK were analyzed by immunoblotting with whole-brain lysate of the control—and NYT-fed NPY-KO zebrafish. The loading control used was (A) total ERK. n = 4. The mRNA levels of (B) HPA axis, (C) SAM axis, (D) GABA, and (E) serotonin-related genes were estimated by real-time PCR using whole brains of the control—and NYT-fed NPY-KO zebrafish. (B) HPA axis-related genes (gr, pomc, crh, ist, avt, and orx). (C) SAM axis-related genes (th1, th2, cck, and dat). (D) GABA-related genes (gad1b and gad2). (E) Serotonin-related genes (tph1a, tph1b, and tph2). The gene expression level of actb was used as an internal reference. Each gene expression level was relative to that in the control-fed NPY-KO zebrafish. n = 5. Results are shown as mean ± standard error of the mean. n.s., not significant.