FIGURE SUMMARY
Title

A comparative analysis of Danionella cerebrum and zebrafish (Danio rerio) larval locomotor activity in a light-dark test

Authors
Lindemann, N., Kalix, L., Possiel, J., Stasch, R., Kusian, T., Köster, R.W., von Trotha, J.W.
Source
Full text @ Front. Behav. Neurosci.

Locomotor activity of 6 dpf zebrafish and Dc larvae in the light-dark test. (A) The light-dark test consists of a habituation (20 min; orange), swimming (20 min; blue) and two alternating dark (10 min each; gray) and light (10 min each; yellow) phases. The average locomotor activity ± the SEM (shaded) per second is shown for zebrafish AB wildtype (green; n = 60), crystal (blue; n = 60), and Dc (red; n = 40) larvae; color-coded arrowheads highlight the increases in locomotor activity 1 s after the illumination switch. (B,C) Violin plots of the velocity during movement (B) and percentage of time spent moving (C) of zebrafish AB wildtype, crystal, and Dc during the habituation (orange) and swimming phase (blue); the mean is indicated by a dotted black line. (D,E) Violin plots of the velocity during movement (D) and percentage of time spent moving (E) of zebrafish AB, crystal, and Dc during the light (yellow) and dark phases (gray); the mean is indicated by a dotted black line. Two-way ANOVA followed by Šídák’s or Tukey’s multiple comparisons test was used to analyze differences in velocity or movement between phases of the light-dark test in and between AB, crystal, and Dc; p > 0.05 is abbreviated as not significant (n.s.).

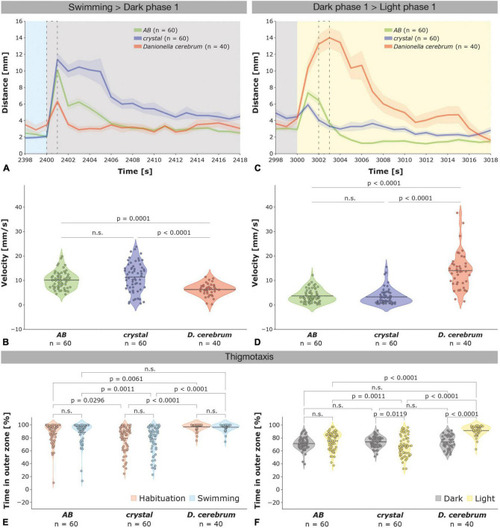
Different startle responses evoked by illumination changes in zebrafish and Dc larvae. (A) Startle responses ± SEM (shaded) of 6 dpf zebrafish AB wildtype (green; n = 60), crystal (blue; n = 60), and Dc (red; n = 40) larvae depicted from 2 s before (2,398 s) to 18 s after (2,418 s) the first light (swimming phase; blue) to dark (dark phase 1; gray) switch (see also Supplementary Figure 1A); a dotted black rectangle indicates the 1 s time interval that was used to compare the velocity of the larvae in (B). (B) Violin plots depicting the velocity of AB, crystal, and Dc larvae during 1 s (2,400–2,401 s) following the first light to dark switch (see also Supplementary Figure 1B). Note that Dc increase their velocity significantly less than AB wildtype and crystal zebrafish. (C) Startle responses of 6 dpf zebrafish AB wildtype (green), crystal (blue), and Dc (red) larvae depicted from 2 s before (2,998 s) to 18 s after (3,018 s) the first dark (gray) to light (yellow) switch (see also Supplementary Figure 1C); a dotted black rectangle indicates the 1 s time interval that was used to compare the velocity of the larvae in (D). (D) Violin plots depicting the velocity of AB, crystal, and Dc larvae during 1 s (3,002–3,003 s) following the first dark to light switch (see also Supplementary Figure 1D). Note that Dc increase their velocity significantly more and during a longer time period than AB wildtype and crystal zebrafish. One-way ANOVA followed by Tukey’s multiple comparisons test or Kruskal–Wallis test followed by Dunn’s multiple comparisons test was used to analyze differences in velocity between AB, crystal, and Dc; p > 0.05 is abbreviated as not significant (n.s.). (E) Violin plots depicting the time spent in the outer zone during the habituation (orange) and swimming (blue) phase is highest in Dc followed by AB, but lower in crystal larvae. (F) Violin plots show that thigmotaxis is increased in Dc relative to both AB and crystal zebrafish larvae during the light but not the dark phases. Two-way ANOVA followed by Šídák’s or Tukey’s multiple comparisons test was used to analyze differences in thigmotaxis between phases of the dark-light test in and between AB, crystal, and Dc; p > 0.05 is abbreviated as not significant (n.s.).

Locomotor activity of 4–6 dpf Dc larvae in the light-dark test. (A) Locomotor activity of 4 dpf (green; n = 32), 5 dpf (blue; n = 28), and 6 dpf (red; n = 40) Dc larvae in the light-dark test; color-coded arrowheads highlight the increases in locomotor activity 1 s after the illumination switch. (B,C) Violin plots of the velocity during movement (B) and the time spent moving (C) for 4–6 dpf Dc larvae in the habituation (red) and swimming (blue) phase. (D,E) Violin plots of the velocity during movement (D) and the time spent moving (E) for 4–6 dpf Dc larvae in the light (yellow) and dark (gray) phases. Note the reduced movement of 4 dpf (C,E) and the lack of increase in velocity during the dark phases (A,D) relative to 5 and 6 dpf Dc larvae. Two-way ANOVA followed by Šídák’s or Tukey’s multiple comparisons test was used to analyze differences in velocity or movement between phases of the light-dark test in and between 4 and 6 dpf Dc; p > 0.05 is abbreviated as not significant (n.s.).

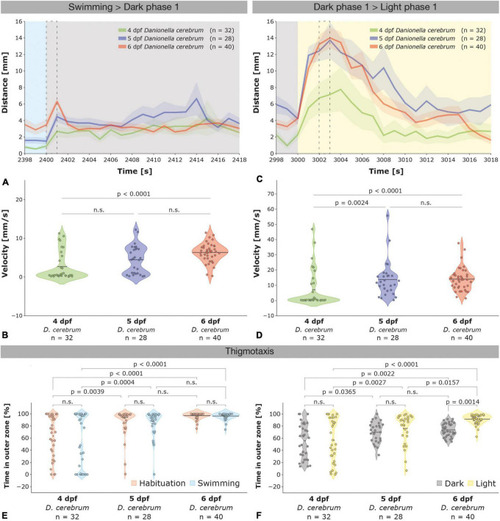
Age-dependent startle responses evoked by illumination changes and thigmotaxis in 4–6 dpf Dc larvae. (A) Startle responses with standard error of the mean (SEM; shaded area) of 4 dpf (green, n = 32), 5 dpf (blue, n = 28), and 6 dpf (red, n = 40) Dc larvae depicted from 2 s before (2,398 s) to 18 s after (2,418 s) the first light (swimming phase; blue) to dark (dark phase 1; gray) switch (see also Supplementary Figure 2A); a dotted black rectangle indicates the 1 s time interval that was used to compare the velocity of the larvae in (B). (B) Violin plots depicting the velocity of 4–6 dpf Dc larvae during 1 s (2,400–2,401 s) following the first light to dark switch (see also Supplementary Figure 2B). (C) Startle responses of 4–6 dpf Dc larvae depicted 2 s before (2,998 s) and 18 s after (3,018 s) the first dark (gray) to light (yellow) switch; see also Supplementary Figure 2C; a dotted black rectangle indicates the 1 s time interval that was used to compare the velocity of the larvae in (D). (D) Violin plots depicting the velocity of 4–6 dpf Dc larvae during 1 s (3,002–3,003 s) following the first dark to light switch (see also Supplementary Figure 2D). Note that 5 and 6 dpf Dc larvae increase their velocity significantly more than 4 dpf. Kruskal–Wallis test followed by Dunn’s multiple comparisons test was used to analyze differences in velocity between 4 and 6 dpf Dc; p > 0.05 is abbreviated as not significant (n.s.). (E,F) Violin plots depicting the time spent in the outer zone of the wells show an age-dependent increase in thigmotaxis in 5 and in 6 dpf compared to 4 dpf Dc larvae during the habituation and swimming (E) and also during the light and dark phases (F). Two-way ANOVA followed by Šídák’s or Tukey’s multiple comparisons test was used to analyze differences in thigmotaxis between phases of the light-dark test in and between 4 and 6 dpf Dc; p > 0.05 is abbreviated as not significant (n.s.).

Acknowledgments
This image is the copyrighted work of the attributed author or publisher, and ZFIN has permission only to display this image to its users. Additional permissions should be obtained from the applicable author or publisher of the image. Full text @ Front. Behav. Neurosci.