
- Title
-
dock8 deficiency attenuates microglia colonization in early zebrafish larvae
- Authors
- Wu, L., Xue, R., Chen, J., Xu, J.
- Source
- Full text @ Cell Death Discov
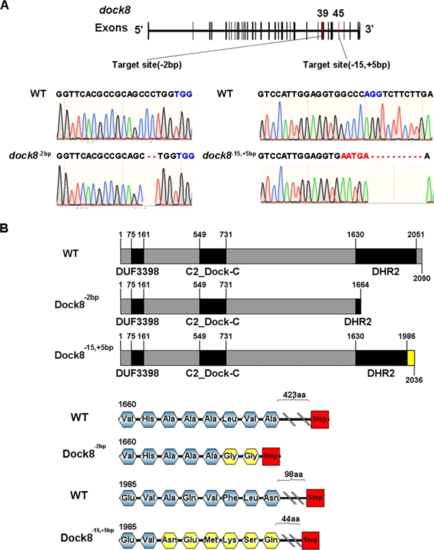
A Sequencing results of the deletion and insertion in dock8-2bp and dock8-15,+5bp mutants. Both mutants were generated by CRISPR/Cas9. gRNA targeted at exon 39 and caused 2 bp deletion. gRNA targeted at exon 45 causing 15 bp deletion and 5 bp insertion. PAM sequence was highlighted in blue. Insertion and deletion were highlighted in red. B Modular structure of WT and truncated protein. Altered amino acids were labeled in yellow. |

A Schematic diagram of the imaging region. Black dash lines represent the imaging area. B, E, H Representative images (B) and quantification of 4 dpf (E) and 6 dpf (H) NR signals of dock8-15,+5bp mutants and siblings. C, F, I Representative images (C) and quantification of 4 dpf (F) and 6 dpf (I) apoeb WISH signals of dock8-15,+5bp mutants and siblings. D, G, J Representative images (D) and quantification of 4 dpf (G) and 6 dpf (J) mpeg1-dsredx positive cells in optic tectum of dock8-15,+5bp mutants and siblings. Group sizes were at least n = 30 zebrafish embryos. Each dot represents one larva. White dashed lines indicate the optic tectum. Scale bar = 100 µm. Data were analyzed by unpaired Student’s t-tests. nsP > 0.05;****P ≤ 0.0001. |
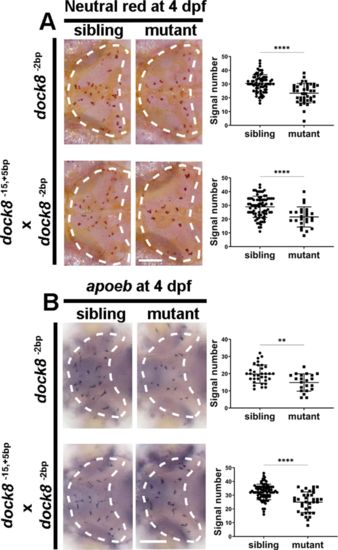
A Representative images and quantification of 4 dpf NR signals of dock8-2bp mutants, dock8-15,+5bp/-2bp compound mutants and siblings. B Representative images and quantification of 4 dpf apoeb WISH signals of dock8-2bp mutants, dock8-15,+5bp/-2bp compound mutants and siblings. Group sizes were at least n = 30 zebrafish embryos. Each dot represents one larva. White dashed lines indicate the optic tectum. Scale bar = 100 µm. Data were analyzed by unpaired Student’s t-tests. **P ≤ 0.01; ****P ≤ 0.0001. |
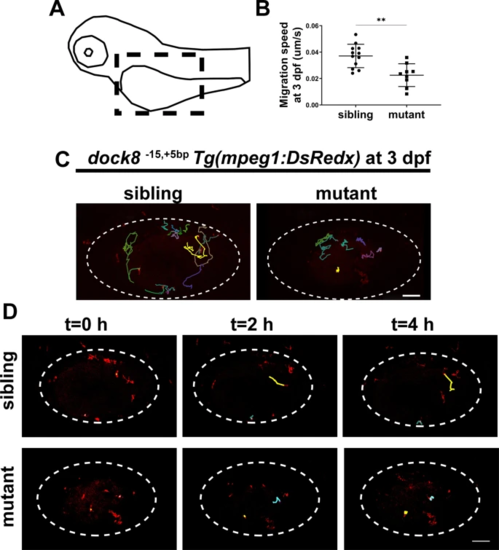
A Schematic diagram of the imaging region. Black dash lines represent the imaging area. B Quantification of migration speed of mpeg1+ cells in dock8-15,+5bp mutants and siblings yolk sac within 4 h from 3 dpf, each dot represents one larva. C Representative images of mpeg1+ cells tracking in dock8-15,+5bp mutants and siblings yolk sac at 3 dpf. Each line represents the migration path of one macrophage. D Time-lapse confocal imaging of Tg(mpeg1:DsRed);dock815,+5bp embryos from 3 dpf within 4 h. Each line represents the migration path of one macrophage. White dotted lines indicate the yolk sac. Scale bar = 100 µm. See also Video S 1. Data were analyzed by unpaired Student’s t-tests. **P ≤ 0.01. EXPRESSION / LABELING:
PHENOTYPE:
|
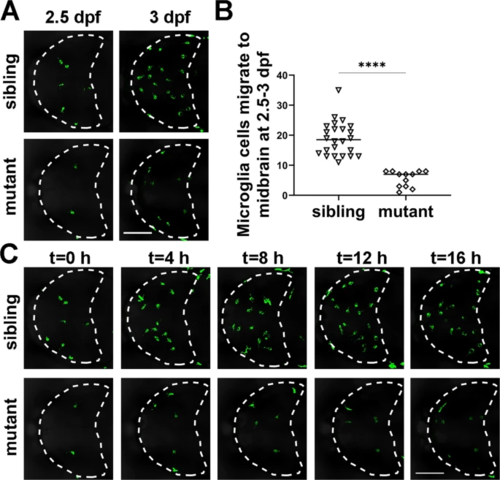
A Representative images of GFP+ microglia in dock8-15,+5bp; Tg(coro1a:GFP) embryos from 2.5 dpf–3 dpf for 10–16 h. B Quantification of GFP+ microglia migrating into the midbrain from 2.5 dpf to 3 dpf in dock8-15,+5bp; Tg(coro1a:GFP) embryos. C Time-lapse confocal imaging of microglia colonization in dock8-15,+5bp; Tg(coro1a:GFP) embryos from 2.5 dpf–3 dpf. Each dot represents one larva. White dotted lines indicate the midbrain. Scale bar = 100 µm. See also Video S2. Data were analyzed by unpaired Student’s t-tests. ****P ≤ 0.0001. EXPRESSION / LABELING:
PHENOTYPE:
|
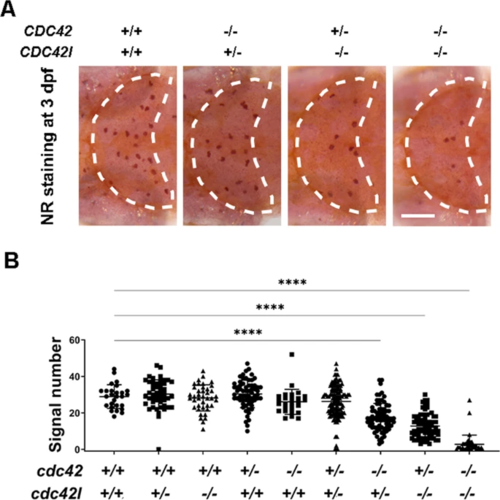
A Representative image of NR staining in cdc42-20bpcdc42l−29bp double mutants at 3 dpf. B Quantification of NR signals in cdc42−20bpcdc42l−29bp double mutants at 3 dpf. Group sizes were at least n = 48 zebrafish embryos. Each dot represents one larva. White dashed lines indicate the optic tectum. Scale bar = 100 µm. Data were analyzed by one-way ANOVA followed by Dunnett’s multiple comparisons test. ****P ≤ 0.0001. PHENOTYPE:
|

ZFIN is incorporating published figure images and captions as part of an ongoing project. Figures from some publications have not yet been curated, or are not available for display because of copyright restrictions. |