FIGURE SUMMARY
Title

Investigation of the causal etiology in a patient with T-B+NK+ immunodeficiency

Authors
Sertori, R., Lin, J.X., Martinez, E., Rana, S., Sharo, A., Kazemian, M., Sunderam, U., Andrake, M., Shinton, S., Truong, B., Dunbrack, R.M., Liu, C., Srinivasan, R., Brenner, S.E., Seroogy, C.M., Puck, J.M., Leonard, W.J., Wiest, D.L.
Source
Full text @ Front Immunol

ZFIN is incorporating published figure images and captions as part of an ongoing project. Figures from some publications have not yet been curated, or are not available for display because of copyright restrictions.

EXPRESSION / LABELING:
Gene:
Fish:
Knockdown Reagent:
Anatomical Term:
Stage: Day 5
PHENOTYPE:
Fish:
Knockdown Reagent:
Observed In:
Stage: Day 5

Identification of the MED14 missense mutation by next generation sequencing. (A) Screen shots of NGS sequencing runs of the proband and parents are depicted. The A>G mutation is indicated by upper and lower case G. Dots or commas indicate wild type sequence. (B) Molecular models of the wild type and variant MED14 proteins. Two views of wild type (orange) and V763A mutant (green) human MED14 are depicted. The right half of each panel shows a zoomed in view of aa 763 with nearby residues on the opposing helix that are capable of making contacts with the A or V763. The left panel shows wild type MED14 V763 from known PDB structure 7ENA chain n, residues 637 to 884. The right panel shows the human V763A MED14 variant. Hydrophobic contacts are shown with purple lines.

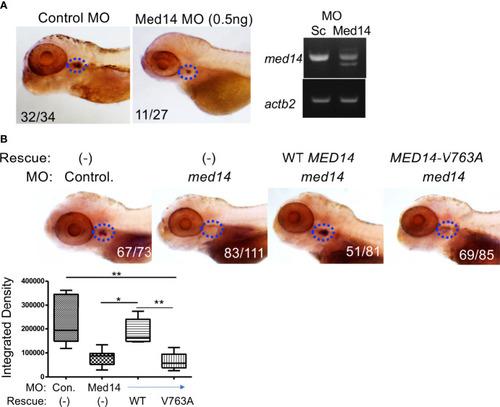
Role of Med14 in Zebrafish T cell Development. (A) The effect of MO knockdown of med14 on T cell development at 5 dpf was assessed by WISH using an lck probe to identify T cells. The numbers on the images reflect the fraction of the embryos with the depicted staining pattern. Thymus staining is outlined by blue dashed ovals. The panel on the right confirms MO induced mis-splicing of med14 mRNA by RT-PCR at 1 dpf with β-actin (actb2) as a loading control. (B) The ability of the wild type and human MED14 variant to rescue loss of endogenous zebrafish med14 was assessed by heat-inducible re-expression of wild type or variant MED14. The effect on T cell development was assessed as above by WISH using an lck probe. The integrated density of WISH staining was measured by ImageJ software and depicted graphically as box plots. Significantly altered groups are indicated. Data are representative of 3 experiments. * p < 0.05, ** p < 0.01.

EXPRESSION / LABELING:
Gene:
Fish:
Knockdown Reagent:
Anatomical Term:
Stage: Day 5
PHENOTYPE:
Fish:
Knockdown Reagent:
Observed In:
Stage: Day 5

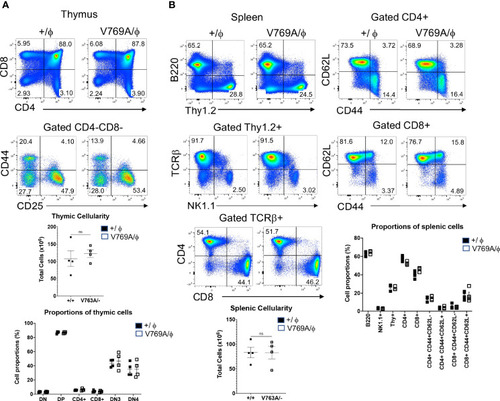
Role of MED14 in Development of Thymic Subpopulations in Zebrafish. The effect of med14 knockdown on cell subpopulations was evaluated at 5 dpf by performing WISH on TLF zebrafish embryos with the indicated probes: lck marks most developing thymocytes, ikaros marks thymic seeding progenitors, tcrd marks γδ lineage progenitors, and foxn1 marks thymic epithelial cells. Blue ovals mark the thymus and frequencies of embryos with the exhibited staining pattern are indicated at the lower left of each image. Data are representative of 3 experiments.

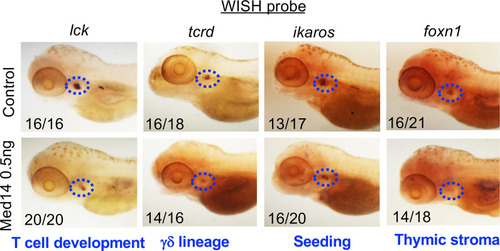
Phenotypic analysis of lymphoid development in Med14 mutant mice. (A) Histograms are displayed of flow cytometry analysis of thymic cell suspensions from wildtype (+/ϕ) and hemizygous Med14 mutant (V769A/ϕ) mice. The following antibodies were used: CD4, CD8, CD44, and CD25. Scatter plots of total thymic cellularity and the frequencies of the indicated populations are depicted. The following populations are graphed: DN, CD4-CD8-; DP, CD4+CD8+; CD4+; CD8+; DN3, CD4-CD8-CD44-CD25+; DN4, CD4-CD8-CD44-CD25-. Proportion of DN3 and DN4 subpopulations among DN thymocytes is depicted graphically (B) Histograms are displayed that illustrate flow cytometric analysis of the lymphoid content of spleens from +/ϕ and V769A/ϕ mice. The following antibodies were used: B220, Thy1.2, NK1.1, CD4, CD8, TCRβ, CD44, and CD62L. Scatter plots of total splenic cellularity and the frequencies of the indicated populations are depicted. Each symbol represents an individual mouse. The proportions of CD4 and CD8 T cells among Thy1+ cells and the proportions of memory subsets among CD4+ and CD8+ subsets are depicted graphically. Data are representative of 3 experiments performed. No statistically significant differences were found in any of the indicated populations.

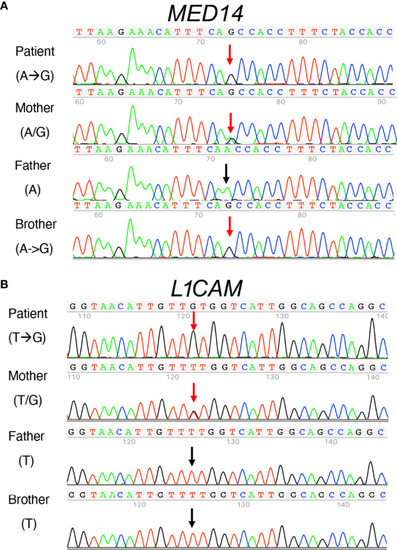
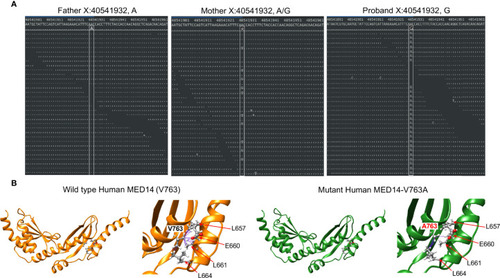
Sanger sequence analysis of MED14 V763A and L1CAM Q498H variants in the patient, his parents, and his healthy brother. (A) The mother carries both alleles with A and G The patient and his healthy brother inherited the same alleles with G, resulting in the same MED14 V763A variant as indicated by red arrows. The PCR-Rev primer was used for sequencing. (B) Patient’s mother carries T and G alleles (red arrow). The patient inherited the allele with G (red arrow), resulting in the L1CAMQ498H variant and his healthy brother inherited the allele with T (see black arrow). His father’s allele also has a T (black arrow). PCR-Fwd primer was used for sequencing.

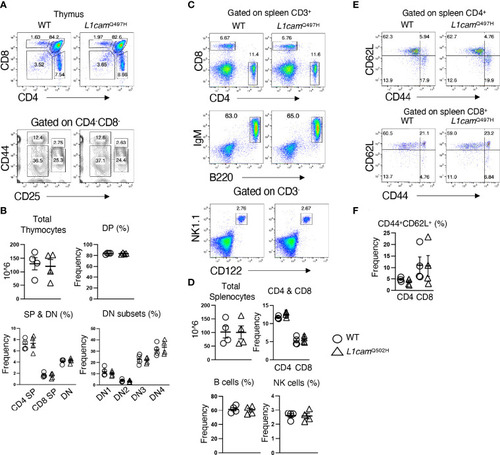
Phenotypic analysis of the L1CAMQ497H knockin mice. (A) Flow cytometric analysis of the frequencies of thymocytes from wildtype (WT) and hemizygous L1cam497H mutant mice. (B) The total and subpopulations of thymic cellularity are shown in bar graphs. The following populations are graphed: DN, CD4-CD8-; DP, CD4+CD8+; CD4+; CD8+; DN1, CD4-CD8-CD25-CD44+; DN2, CD4-CD8-CD25+CD44+; DN3, CD4-CD8-CD44-CD25+; DN4, CD4-CD8-CD44-CD25-. (C) Flow cytometry analysis of splenic CD4+ and CD8+ T cells, B (B220+IgM+) and NK (CD3-CD122+NK1.1+) cells in WT and L1camQ497H mutant mice. (D) The total and subpopulations of splenic cellularity are shown in bar graphs. (E) Flow cytometry analysis of CD44 and CD62L staining of CD4+ and CD8+ T cells. (F) The frequency of CD44+CD62L+ in CD4+ and CD8+ T cells is shown in bar graphs. Data are representative of 2 independent experiments performed. No statistically significant differences were found in any of the indicated populations.

Acknowledgments
This image is the copyrighted work of the attributed author or publisher, and ZFIN has permission only to display this image to its users. Additional permissions should be obtained from the applicable author or publisher of the image. Full text @ Front Immunol