
- Title
-
The EGFR/ErbB inhibitor neratinib modifies the neutrophil phosphoproteome and promotes apoptosis and clearance by airway macrophages
- Authors
- Herman, K.D., Wright, C.G., Marriott, H.M., McCaughran, S.C., Bowden, K.A., Collins, M.O., Renshaw, S.A., Prince, L.R.
- Source
- Full text @ Front Immunol
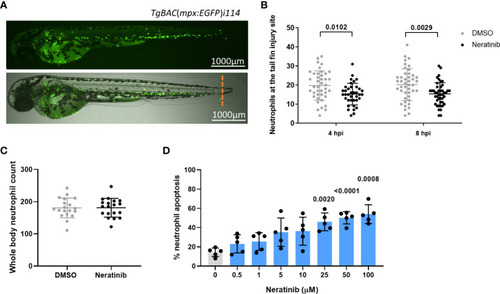
Neratinib reduces neutrophilic inflammation at the tail fin injury site of zebrafish larvae in vivo and induces apoptosis of human neutrophils in vitro. Neutrophils in zebrafish larvae can be enumerated by fluorescence microscopy using the transgenic line TgBAC(mpx:EGFP)i114, in which each GFP-expressing (green) cell is counted as one neutrophil (A). Tail fin transection (A, orange dotted line) was performed after 16 h of treatment with neratinib, and neutrophils at the site of injury enumerated 4 and 8 h post-injury. Larvae treated with neratinib had reduced numbers of neutrophils at the tail fin injury site at both time points in comparison to DMSO-treated larvae (B). Minimum n = 30 larvae per condition across three experimental repeats; data analyzed by two-way ANOVA with Sidak’s multiple comparisons. Total neutrophil number across the whole body of larvae was unchanged after 16 h of treatment with 10 μM of neratinib, in comparison to control DMSO-treated larvae (C). N = 20 larvae per condition across three independent experiments; data analyzed by unpaired t-test. In human neutrophils isolated from whole-blood samples from healthy volunteers, treatment with neratinib in vitro results in a dose-dependent increase in the rate of apoptosis (D). N = 5 healthy blood donors; data analyzed by one-way ANOVA with Dunnett’s multiple comparisons, comparing each neratinib concentration with the DMSO control treatment. Each data point represents data from one larva or human blood donor. Bars show mean ± standard deviation. p-values are indicated, where p <0.05. |

Phosphoproteomic analysis of human neutrophils shows that neratinib treatment induces changes in phosphorylated proteins regulating numerous biological processes. STRING identified interactions between phosphorylated proteins in the combined “DMSO-enriched” and “statistically higher abundance in DMSO” datasets (A) and the combined “neratinib-enriched” and “statistically higher abundance in neratinib” datasets (B). Venn diagrams show the number of phosphopeptides and proteins they map to in each dataset and the overlapping proteins between the two datasets for each treatment group. STRING analysis of these datasets indicates interactions between proteins (lines). STRING also identified a number of Gene Ontology (GO) biological processes that were statistically enriched in both treatment groups, highlighted in color. The neratinib-enriched treatment group had only one statistically enriched biological process, and so statistically enriched keywords from the UniProt database are also shown. Both datasets were searched for the keyword “apoptosis,” and hit proteins were highlighted with a pink outline. |
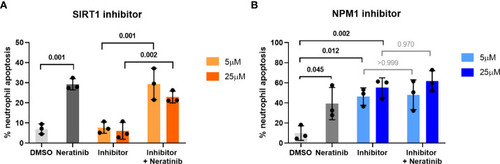
Pharmacological inhibition of candidates from the phosphoproteomic analysis reveals NPM1 as potentially being downstream of neratinib-induced neutrophil apoptosis. Human neutrophils were incubated with inhibitors of SIRT1 or NPM1, alone or in combination with 25 μM of neratinib, for 6 h, after which the levels of apoptosis were assessed by morphology. In both experiments, neratinib alone induced neutrophil apoptosis in comparison to the DMSO control, as expected. The inhibitor of SIRT1 (EX527) did not induce human neutrophil apoptosis (A). The inhibitor of NPM1 (NSC348884) did induce human neutrophil apoptosis (B), and no additional apoptosis was observed when this inhibitor was used in combination with neratinib. Each data point shows data from one healthy donor (n = 3); bars represent mean ± standard deviation. One-way ANOVA with multiple comparisons was used to calculate statistical significance; p-values were indicated. |

Neratinib treatment in a mouse LPS-induced acute lung injury model increases the rates of macrophage efferocytosis and reduces the number of neutrophil corpses in bronchoalveolar lavage fluid. Schematic of the treatment protocol (A). Cytospins of BAL were stained with Kwik-Diff and examined by light microscopy, and neutrophils, macrophages, and lymphocytes were identified by morphology (B). Total cells in BAL were counted using the hemocytometer counting chamber (C), and the percentage of neutrophils (D), macrophages (E), and lymphocytes (F) in BAL were unchanged between treatment groups. The engulfment of cell debris by macrophages is visible as inclusions within intracellular vesicles, which can be identified with Kwik-Diff staining and light microscopy (G, red arrows). Many macrophages contained vesicles, but these were empty of debris (G, left panel). Cell debris may be broken into small pieces within a vesicle (G, middle panel, left) or fill the vesicles (G, middle panel, right). Macrophages may contain one or more vesicles with inclusions; in some cases, too many to count accurately (G, right panel); if above 6, the number of inclusions was recorded as 6. Both the percentage of macrophages containing any inclusions (H) and the total number of inclusions per 100 macrophages (I) were increased in the neratinib treatment group. Cells in BAL were also analyzed by flow cytometry, and the percentage of TO-PRO-3+ cells (J) and TO-PRO-3+ neutrophils (Ly6G+ cells) (K) was reduced in neratinib-treated mice. Concentrations of the cytokines IL-6 (L) and KC (M) were analyzed in BAL supernatant by ELISA and were unchanged between treatment groups. Each data point in the graphs represents data from one mouse (n = 6 per treatment group); bars show mean ± standard deviation. Unpaired t-tests were used for statistical analysis; p-values were indicated, where p <0.05. |

No changes in efferocytosis or cell corpse numbers were observed with neratinib treatment in chronic models of lung disease. Two different dosing protocols were used for neratinib treatment in the chronic lung disease model: induction dosing (A) and therapeutic dosing (B). Uptake of cell debris by macrophages was unchanged between treatment groups in both the induction dosing (C, D) and therapeutic dosing (E, F) models. The percentage of TO-PRO-3+ cells in BAL, assessed by flow cytometry, was unchanged in the induction dosing model (G) and the therapeutic dosing model (H). Leukocyte number in BAL and the percentage of neutrophils, macrophages, and lymphocytes were similarly unchanged across both models (I–P). Each data point in graphs represents data from one mouse; bars show mean ± standard deviation. Induction dosing study: n = 6 vehicle-treated mice, n = 7 neratinib-treated mice; therapeutic dosing study: n = 7 mice in each treatment group. Unpaired t-tests were used for statistical analysis. |

Neratinib does not alter alveolar area or perimeter in chronic mouse models of lung disease. Fixed mouse lung tissue slices were stained with H&E (A). Alveoli were identified by a lumen surrounded by characteristically thin squamous epithelial cells and classified as intact (blue stars) or damaged (red stars) and differentiated from bronchioles (orange arrowhead) as described in the Materials and methods. Area and perimeter measurements were calculated using the outline tool (dotted lines) in NIS-Elements. Initially, random alveoli were selected for analysis; however, this resulted in the majority measured being intact (B, C). Each dot represents one alveolus, line at median; 20 alveoli measured across two lung slices per mouse, in the induction dosing study. To assess only damaged alveoli, a lower threshold of 500 μm2 for area and 75 μm for perimeter was set, and alveoli below these sizes were excluded from the analysis. Median damaged alveolar area and perimeter per mouse were assessed, and no differences between treatment groups were found with either the induction dosing protocol (D, E) or the therapeutic dosing protocol (F, G). (D–G) Each dot represents one median alveolar area/perimeter per mouse, calculated from 20 alveolar measurements across two lung slices. Bars show mean ± standard deviation. Unpaired t-test was used to compare treatment groups. |
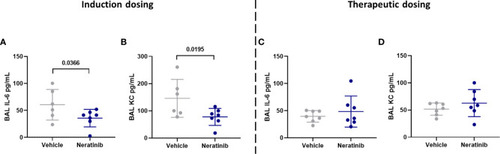
Neratinib treatment reduces the levels of cytokines IL-6 and KC in BAL in the induction dosing model of lung disease. Cytokines were measured in BAL supernatant by ELISA. Interleukin-6 (IL-6) and KC were reduced in neratinib-treated mice in the induction dosing model (A, B), whereas these were unchanged in the therapeutic dosing model (C, D). Each data point represents data from one mouse; bars show mean ± standard deviation. Unpaired t-tests were used for statistical analysis; p-values were indicated. |

Neratinib does not alter the numbers or distribution of circulating leukocytes in chronic mouse models of lung disease. Leukocytes in mouse whole-blood samples were analyzed using an automated hematology blood analyzer, which counts total leukocytes as well as differentiates between lymphocytes, neutrophils, and monocytes; the percentages of each leukocyte subset are also analyzed. No differences in the number of leukocytes, or their subsets, were identified between the vehicle- and neratinib-treated groups in the induction dosing (A) or therapeutic dosing (B) model, and similarly, no differences in the percentages of lymphocytes, neutrophils, and monocytes were found between treatment groups in the induction (C) or therapeutic (D) dosing model. Each data point represents data from one mouse; bars show mean ± standard deviation. Unpaired t-tests were used to compare treatment groups within each cell type; p-values were indicated where appropriate. |

Neratinib reduces neutrophilic inflammation at the tail fin injury site of zebrafish larvae |
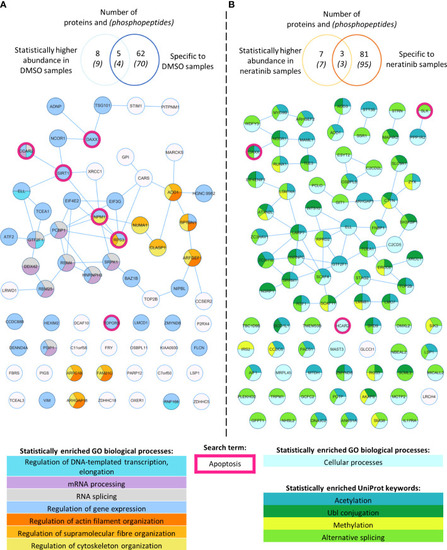
Phosphoproteomic analysis of human neutrophils shows that neratinib treatment induces changes in phosphorylated proteins regulating numerous biological processes. STRING identified interactions between phosphorylated proteins in the combined “DMSO-enriched” and “statistically higher abundance in DMSO” datasets |

Pharmacological inhibition of candidates from the phosphoproteomic analysis reveals NPM1 as potentially being downstream of neratinib-induced neutrophil apoptosis. Human neutrophils were incubated with inhibitors of SIRT1 or NPM1, alone or in combination with 25 μM of neratinib, for 6 h, after which the levels of apoptosis were assessed by morphology. In both experiments, neratinib alone induced neutrophil apoptosis in comparison to the DMSO control, as expected. The inhibitor of SIRT1 (EX527) did not induce human neutrophil apoptosis |
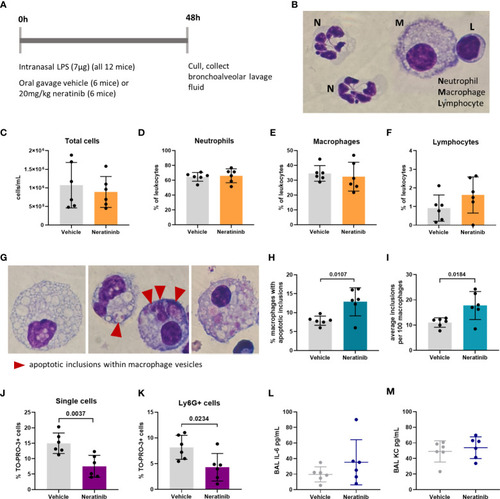
Neratinib treatment in a mouse LPS-induced acute lung injury model increases the rates of macrophage efferocytosis and reduces the number of neutrophil corpses in bronchoalveolar lavage fluid. Schematic of the treatment protocol |
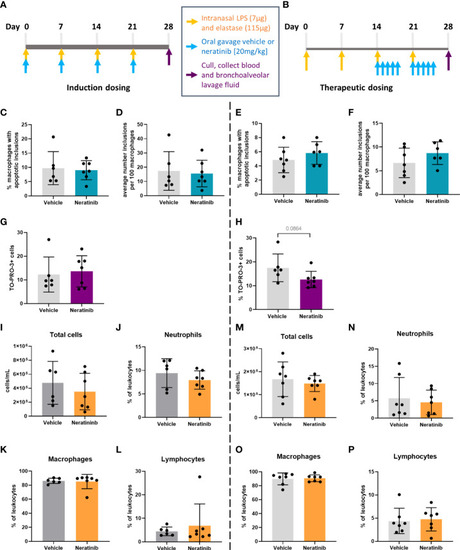
No changes in efferocytosis or cell corpse numbers were observed with neratinib treatment in chronic models of lung disease. Two different dosing protocols were used for neratinib treatment in the chronic lung disease model: induction dosing |
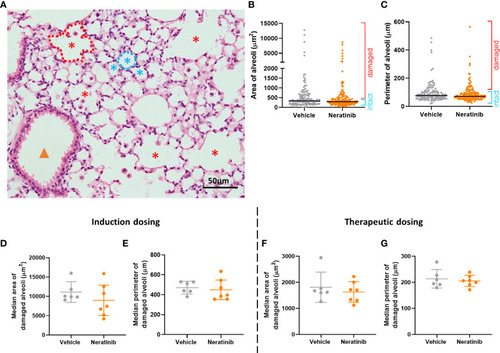
Neratinib does not alter alveolar area or perimeter in chronic mouse models of lung disease. Fixed mouse lung tissue slices were stained with H&E |

Neratinib treatment reduces the levels of cytokines IL-6 and KC in BAL in the induction dosing model of lung disease. Cytokines were measured in BAL supernatant by ELISA. Interleukin-6 (IL-6) and KC were reduced in neratinib-treated mice in the induction dosing model |
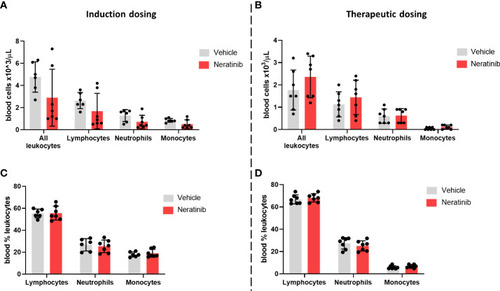
Neratinib does not alter the numbers or distribution of circulating leukocytes in chronic mouse models of lung disease. Leukocytes in mouse whole-blood samples were analyzed using an automated hematology blood analyzer, which counts total leukocytes as well as differentiates between lymphocytes, neutrophils, and monocytes; the percentages of each leukocyte subset are also analyzed. No differences in the number of leukocytes, or their subsets, were identified between the vehicle- and neratinib-treated groups in the induction dosing |