
- Title
-
Targeting phosphoglycerate kinase 1 with terazosin improves motor neuron phenotypes in multiple models of amyotrophic lateral sclerosis
- Authors
- Chaytow, H., Carroll, E., Gordon, D., Huang, Y.T., van der Hoorn, D., Smith, H.L., Becker, T., Becker, C.G., Faller, K.M.E., Talbot, K., Gillingwater, T.H.
- Source
- Full text @ EBioMedicine
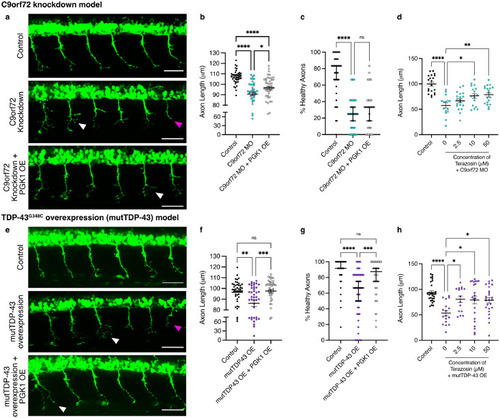
Targeting PGK1 genetically or pharmacologically improves motor axon phenotypes in zebrafish ALS models. (a) Representative fluorescent micrographs showing HB9:GFP+ve primary motor neuron outgrowth in uninjected controls, with morpholino-induced C9orf72 knockdown and with co-overexpression of PGK1. Knockdown of C9orf72 produces the motor axon phenotype of shorter axons (magenta arrows) and increased branching (white arrows). Scale bar=50 µM (b) C9orf72-knockdown (C9orf72 MO) decreases mean axon length and overexpression of PGK1 partially rescues this phenotype (one-way ANOVA P < 0.0001 with Tukey's multiple comparison test: Control vs C9orf72 MO P < 0.0001, C9orf72 MO vs C9orf72 MO + PGK1 OE P = 0.016; n = 39-45 per treatment group, n = 3 clutches). (c) Number of axons scored as “healthy”, i.e. unbranched, in branching analysis. PGK1 overexpression does not change the branching phenotype in C9orf72 MO fish (Kruskal-Wallis P < 0.0001 with Dunn's multiple comparison test: Control vs C9orf72 MO P < 0.0001, C9orf72 MO vs C9orf72 MO + PGK1 OE P = 0.89; n = 39-45 per treatment group, n = 3 clutches). (d) C9orf72 MO larvae treated with increasing concentrations of terazosin. Terazosin significantly increases axon lengths at 10 µM and 50 µM (one-way ANOVA P < 0.0001 with Dunnett's multiple comparison test: Control vs C9orf72 MO P < 0.0001, C9orf72 MO vs 2.5 mM terazosin P = 0.40, C9orf72 MO vs 10 mM terazosin P = 0.02, C9orf72 MO vs 50 mM terazosin P = 0.005; n = 15-20 per treatment, n = 3 clutches). (e) Micrographs showing HB9:GFP+ve primary motor neuron outgrowth in uninjected controls, with mutant TDP-43G348C (mutTDP-43) overexpression and with co-overexpression of PGK1. Overexpression of mutTDP-43 produces the motor axon phenotype of shorter axons (magenta arrows) and increased branching (white arrows). Scale bar=50 µM. (f) mutTDP-43 overexpression (OE) decreases mean axon length and overexpression of PGK1 rescues this phenotype (one-way ANOVA P = 0.0003 with Tukey's multiple comparison test: Control vs mutTDP43 OE P = 0.003, mutTDP43 OE vs mutTDP43 OE + PGK1 OE P = 0.0006, Control vs mutTDP43 OE + PGK1 OE P = 0.92; n = 44-51 per treatment, n = 3 clutches). (g) Number of axons scored as “healthy”, i.e. unbranched, in branching analysis. PGK1 overexpression significantly increases the number of “healthy” axons in the mutTDP-43 OE larvae (Kruskal-Wallis P < 0.0001 with Dunn's multiple comparison test: Control vs mutTDP43 OE P < 0.0001, mutTDP43 OE vs mutTDP43 OE + PGK1 OE P = 0.0006, Control vs mutTDP43 OE + PGK1 OE P = 0.13; n = 44-51 per treatment, n = 3 clutches). (h) mutTDP-43 OE larvae treated with increasing concentrations of terazosin. Terazosin significantly increases axon lengths at 2.5 mM, 10 µM and 50 µM (one-way ANOVA P = 0.0002 with Dunnett's multiple comparison test: Control vs mutTDP43 OE P < 0.0001, mutTDP43 OE vs 2.5 mM terazosin P = 0.017, mutTDP43 OE vs 10 mM terazosin P = 0.012, mutTDP43 OE vs 50 mM terazosin P = 0.0120; n = 15-29 per treatment, n = 3 clutches). Error bars represent s.e.m., ns=non-significant, * = P < 0.05, ** = P < 0.01, *** = P < 0.001, **** = P < 0.0001. PHENOTYPE:
|

Targeting PGK1 improves motor function in zebrafish ALS models at 72 hpf. (a) Results and representative path traces from the TEER (touch-evoked escape response) test in C9orf72 MO larvae following PGK1 overexpression show a significant increase in distance moved following a tail touch (One-way ANOVA P < 0.0001 with Tukey's multiple comparison test: Control vs C9orf72 MO P < 0.0001, C9orf72 MO vs C9orf72 + PGK1 OE P = 0.02). Scale bar=10 mm. (b) Results and representative path traces from the TEER (touch-evoked escape response) test in mutTDP43 OE larvae following PGK1 overexpression show a significant increase in distance moved following a tail touch (One-way ANOVA P < 0.0001 with Tukey's multiple comparison test: Control vs mutTDP-43 OE P = 0.009, mutTDP-43 OE vs mutTDP-43 OE + PGK1 OE P < 0.0001). Scale bar=10 mm. (c) Results and representative path traces from the TEER test in C9orf72 MO larvae following daily terazosin (Tz) shows no difference in distance moved (One-way ANOVA P = 0.001 with Tukey's multiple comparison test: Control vs C9orf72 MO P = 0.001, C9orf72 MO vs C9orf72 + Tz P = 0.70). Scale bar=10 mm. (d) Results and representative path traces from the TEER test in mutTDP-43 OE larvae following daily terazosin (Tz) treatment shows a significant increase in distance moved following a tail touch (unpaired t-test, P = 0.0047). Scale bar=10 mm. Each point represents the average of 3 trials from a single larva. n = 2 clutches, n = 12-20 per group. Error bars represent s.e.m., ns=non-significant, * = P < 0.05, ** = P < 0.01, **** = P < 0.0001. PHENOTYPE:
|

Treating hTDP-43 mice with terazosin significantly improves survival and clinical phenotypes. (a) Survival analysis for hTDP-43 mice shows a significant increase in survival when treated with 10 µg/kg (P = 0.0002; Log-rank Mantel-Cox test) or 100 µg/kg terazosin (P = 0.0023; Log-rank Mantel-Cox test) compared to vehicle controls. (b) Mice treated with 100 µg/kg terazosin show a significant increase in body weight compared to saline controls (n = 10-13 per group; One-way ANOVA P = 0.033 with Dunnett's multiple comparison test: Saline vs 10 µg/kg P = 0.67, Saline vs 100 µg/kg P = 0.025). (c) Clinical scores per treatment group at P19. Mice treated with 100 µg/kg terazosin show a significantly lower clinical score at P19 compared to saline controls (n = 10-13 per group; Kruskal-Wallis test P = 0.014 with Dunn's multiple comparison test: Saline vs 10 µg/kg P = 0.065, Saline vs 100 µg/kg P = 0.009). (d) Representative micrographs of lumbar spinal cord sections from hTDP-43 mice treated with saline vehicle control or 100 µg/kg terazosin. Motor neurons were defined as cells in the ventral horn with the shortest diameter >20 µm, represented by white arrows. Scale bar=20 µm. (e) Quantification of number of motor neurons shows a significant increase in motor neuron number following terazosin treatment (t-test P = 0.0132; n = 3-4 mice per treatment group, each point = average of 4-6 ventral horns) Error bars represent s.e.m., * = P < 0.05, ** = P < 0.01. Each point represents one mouse. |

Terazosin protects against NaArO2-induced cell death, increases glycolysis and decreases mitochondrial respiration in mESC-MNs. (a) TDP-43M337V mESC-MNs show a decreased survival in response to sodium arsenite (NaArO2) stress compared to unstressed controls. Survival following terazosin treatment at all concentrations is maintained at 100%. (n = 3 differentiations; One-way ANOVA P < 0.001 with Dunnett's multiple comparisons). (b) Traces from the Seahorse analyser glycolytic rate assay showing glycolytic proton efflux rate (GlycoPER) following mitochondrial inhibition (oligomycin) and inhibition of the glycolysis pathway (2-deoxy-D-glucose; 2-DG). (c) TDP-43M337V mESC-MNs demonstrate a significantly lower rate of basal glycolysis compared to TDP-43WT controls, which is rescued by treatment of 2.5 µM terazosin (Tz) (One-way ANOVA P = 0.017 with Bonferroni's multiple comparison test: TDP-43WT + NaArO2 vs TDP-43M337V + NaArO2P = 0.034, TDP-43WT + NaArO2 vs TDP-43M337V + NaArO2 + 2.5 µM Tz P > 0.99). (d) TDP-43M337V mESC-MNs show significantly reduced rates of compensatory glycolysis compared to TDP-43WT controls, which is rescued by treatment of 2.5 µM terazosin (Tz) (One-way ANOVA P = 0.055 with Bonferroni's multiple comparison test: TDP-43WT + NaArO2 vs TDP-43M337V + NaArO2P = 0.038, TDP-43WT + NaArO2 vs TDP-43M337V + NaArO2 + 2.5 µM Tz P = 0.22). (e) Traces from the Seahorse analyser showing oxygen consumption rate (OCR) following mitochondrial inhibition (oligomycin), mitochondrial uncoupling (FCCP) and electron transport chain inhibition (antimycin A/rotenone). (f) Treatment with 2.5 µM terazosin significantly decreases basal respiration in TDP-43M337V mESC-MNs compared to TDP-43WT controls (One-way ANOVA P = 0.001 with Bonferroni's multiple comparison test: TDP-43WT + NaArO2 vs TDP-43M337V + NaArO2P > 0.99, TDP-43WT + NaArO2 vs TDP-43M337V + NaArO2 + 2.5 µM Tz P = 0.003). (g) Treatment with 2.5 µM terazosin significantly decreases maximal respiration in TDP-43M337V mESC-MNs compared to TDP-43WT controls (One-way ANOVA P = 0.003 with Bonferroni's multiple comparison test: TDP-43WT + NaArO2 vs TDP-43M337V + NaArO2P = 0.091, TDP-43WT + NaArO2 vs TDP-43M337V + NaArO2 + 2.5 µM Tz P = 0.002). (h) Treatment with 2.5 µM terazosin significantly decreases ATP production in TDP-43M337V mESC-MNs compared to TDP-43WT controls (One-way ANOVA P = 0.004 with Bonferroni's multiple comparison test: TDP-43WT + NaArO2 vs TDP-43M337V + NaArO2P = 0.87, TDP-43WT + NaArO2 vs TDP-43M337V + NaArO2 + 2.5 µM Tz P = 0.018). (i) Treatment with 2.5 µM terazosin does not change the spare respiratory capacity in TDP-43M337V mESC-MNs compared to TDP-43WT controls (One-way ANOVA P = 0.19 with Bonferroni's multiple comparison test: TDP-43WT + NaArO2 vs TDP-43M337V + NaArO2P = 0.16, TDP-43WT + NaArO2 vs TDP-43M337V + NaArO2 + 2.5 µM Tz P = 0.38). Each data point represents a separate differentiation; n = 7 per glycolysis analysis; n = 6 per respiration analysis. Error bars represent s.e.m., ns=non-significant, * = P < 0.05, ** = P < 0.01. |
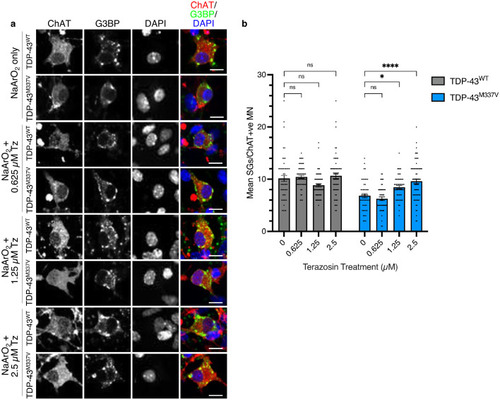
Terazosin rescues stress granule formation. (a) Images of TDP-43WT and TDP-43M337V mESC-MNs following NaArO2-induced oxidative stress with treatment of increasing doses of terazosin. Red channel shows ChAT (motor neuron marker), green channel shows G3BP (stress granule marker), blue channel shows DAPI (nuclear marker). (b) TDP-43M337V mESC-MNs show an impairment in the ability to produce stress granules compared to TDP-43WT controls. Treatment with terazosin has no effect on stress granule formation in TDP-43WT mESC-MNs (One-way ANOVA P = 0.013 with Dunnett's multiple comparisons: 0 µM Tz vs 0.625 µM Tz P = 0.95; 0 µM Tz vs 0.125 µM Tz P = 0.081; 0 µM Tz vs 2.5 µM P = 0.77), but increases the mean number of stress granules per motor neuron in TDP-43M337V mESC-MNs in a dose-dependent manner (One-way ANOVA P < 0.0001 with Dunnett's multiple comparisons: 0 µM Tz vs 0.625 µM Tz P = 0.63; 0 µM Tz vs 0.125 µM Tz P = 0.015; 0 µM Tz vs 2.5 µM P < 0.0001). N = 3 differentiations, n > 30 random cells per differentiation. Error bars represent s.e.m., ns=non-significant, * = P < 0.05, *** = P < 0.001. |