
- Title
-
Leptin mutation and mycobacterial infection lead non-synergistically to a similar metabolic syndrome
- Authors
- Ding, Y., Haks, M.C., van den Eeden, S.J.F., Ottenhoff, T.H.M., Harms, A.C., Hankemeier, T., Eeza, M.N.H., Matysik, J., Alia, A., Spaink, H.P.
- Source
- Full text @ Metabolomics

Bacterial loads and metabolic profiles of lepb+ and lepbibl54 zebrafish larvae in the absence and presence of M. marinum infection. A Representative overlap images of bright field and fluorescent images of 5 dpf entire zebrafish larvae (left panel) and the tail part of the larvae (right panel) from the lepb+ and lepbibl54 group in the absence and presence of infection. B Quantifications of bacterial pixels of the entire larvae in four groups. **p < 0.01, ****p < 0.0001. C PLS-DA analysis of metabolic profiles of pooled zebrafish larvae measured by HR-MAS NMR spectroscopy from the four groups. PLS-DA partial least square discriminant analysis. D The representative HR-MAS NMR spectra of pooled zebrafish larvae from the fours groups. Acet acetate, Ala alanine, Arg arginine, Asp aspartate, Chol cholesterol, Cit citrulline, Cys cysteine, Eta ethanolamine, FA fatty acid, Glc glucose, Gln glutamine, Glu glutamate, Gly glycine, His histidine, Ile isoleucine, Lac lactate, Leu leucine, Lys lysine, Met methionine, Phe phenylalanine, Pu putrescine, Ser serine, Tau taurine, Thr threonine, tCr total creatine (creatine + phosphocreatine), Trp tryptophan, Tyr tyrosine, NMR nuclear magnetic resonance PHENOTYPE:
|

Venn diagrams show the number of metabolites measured by HR-MAS NMR spectroscopy in response to infection in the lepb+ and lepbibl54 zebrafish larvae. A A Venn diagram shows the number of metabolites in response to M. marinum infection in the lepb+ and lepbibl54 larvae with p < 0.05. B A Venn diagram shows the number of metabolites in response to M. marinum infection in the lepb+ and lepbibl54 larvae with p < 0.05 and FC > 1.5 or FC < − 1.5. FC fold change. C Quantification of the common six metabolites in B. ****p < 0.0001. D Quantification of the one metabolite lactate in A. *p < 0.05. ns non-significant. E Quantification of the one metabolite trimethylamine N-oxide in B. **p < 0.01, ***p < 0.001 |
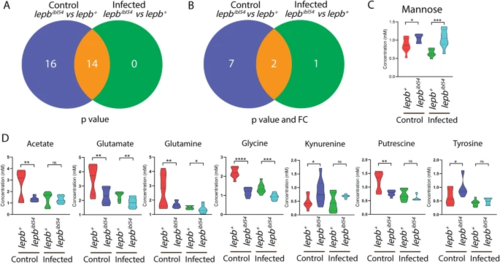
Venn diagrams show the number of metabolites from pooled zebrafish larvae measured by HR-MAS NMR spectroscopy between the lepbibl54 and lepb+ in the uninfected control and infected conditions. A A Venn diagram shows the number of metabolites between the lepbibl54 and lepb+ zebrafish larvae in the uninfected control and infected conditions with p < 0.05. B A Venn diagram shows the number of metabolites between the lepbibl54 and lepb+ zebrafish larvae in the uninfected control and infected conditions with p < 0.05 and FC > 1.5 or FC < − 1.5. FC fold change. C Quantification of the one metabolite mannose in B. *p < 0.05, ***p < 0.001. D Quantification of the seven metabolites in B. **p < 0.01, ****p < 0.0001. ns non-significant PHENOTYPE:
|
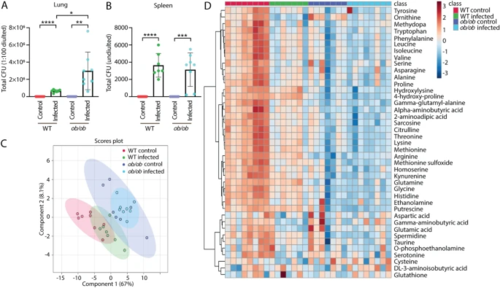
Bacterial loads and metabolic profiles of the blood of wild type and ob/ob mice with and without Mtb infection. A Total CFU (1:100 diluted) of the lungs from the WT and ob/ob mice in the absence and presence of infection. CFU colony forming unit, WT wild type. *p < 0.05, **p < 0.01, ****p < 0.0001. B Total CFU (undiluted) of the spleen from the four groups. ***p < 0.001. C PLS-DA analysis of the blood metabolic profiles measured by mass spectrometry from the four mouse groups. PLS-DA partial least square discriminant analysis. D Heatmap analysis of the blood metabolic profiles measured by mass spectrometry from the four mouse groups |
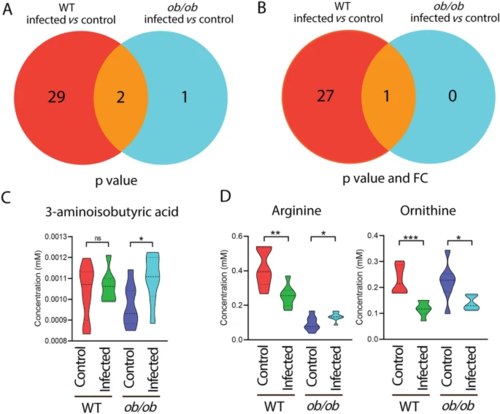
Venn diagrams show the number of metabolites measured by mass spectrometry in response to infection in the blood of wild type and ob/ob mice. A A Venn diagram shows the number of metabolites in response to Mtb infection in the blood of WT and ob/ob mice with p < 0.05. WT wild type. B A Venn diagram shows the number of metabolites in response to Mtb infection in the blood of wild type and ob/ob mice with p < 0.05 and FC > 1.5 or FC < − 1.5. FC fold change. C Quantification of the one metabolite 3-aminoisobutyric acid in A. *p < 0.05. ns non-significant. D Quantification of the two common metabolites arginine and ornithine in A. *p < 0.05, **p < 0.01, ***p < 0.001 |

Venn diagrams show the number of metabolites measured by mass spectrometry between the blood of wild type and ob/ob mice in the uninfected control and infected conditions. A A Venn diagram shows the number of metabolites between the blood of WT and ob/ob mice in the uninfected control and infected conditions with p < 0.05. WT wild type. B A Venn diagram shows the number of metabolites between the blood of WT and ob/ob mice in the uninfected control and infected conditions with p < 0.05 and FC > 1.5 or FC < − 1.5. FC fold change. C Quantification of the one metabolite putrescine in A and B. ****p < 0.0001. ns non-significant |
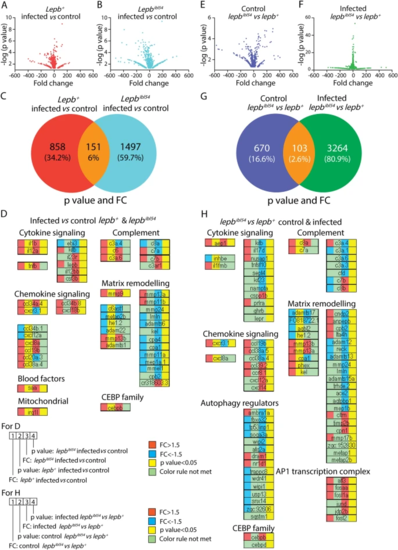
Transcriptome signature sets of lepbibl54 and lepb+ zebrafish larvae at 5 dpi in the absence and presence of M. marinum infection. A A volcano plot of the signature set of lepb+ infected larvae compared to the lepb+ uninfected control. We used p < 0.05 and FC > 1.5 or FC < − 1.5 as cutoff values for all the figures. B A volcano plot of the signature set of lepbibl54 infected larvae compared to the lepbibl54 uninfected control. C A Venn diagram shows the number of differentially expressed genes (DEGs) in response to infection in the lepb+ and lepbibl54 larvae. D The FC and p value of the three groups of genes, shown in C, belonging to the two GO terms “response to bacterium” and “inflammatory responses”. E A volcano plot of the signature set of lepbibl54 compared to lepb+ larvae in the uninfected control situation. F A volcano plot of the signature set of lepbibl54 compared to lepb+ larvae in the infected situation. G A Venn diagram shows the number of DEGs between the lepbibl54 and lepb+ in the uninfected control and infected conditions. H The FC and p value of the three groups of genes, shown in G, belonging to the two GO terms |

Genes regulated in glycolysis and gluconeogenesis pathway. A The DEGs in response to infection in the lepb+ and lepbibl54 larvae. B The DEGs between the lepbibl54 and lepb+ in the uninfected control and infected conditions. C The expression level of pck1 in different groups detected by luciferase reporter assay (n = 24) |
|
ZFIN is incorporating published figure images and captions as part of an ongoing project. Figures from some publications have not yet been curated, or are not available for display because of copyright restrictions. PHENOTYPE:
|