
|
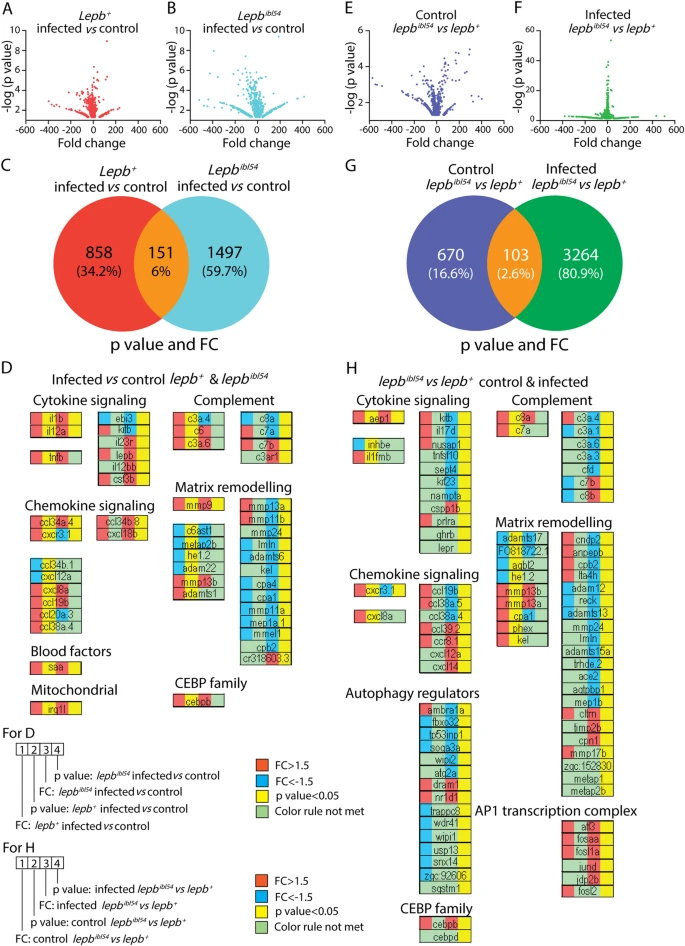
Fig. 7
Transcriptome signature sets of lepbibl54 and lepb+ zebrafish larvae at 5 dpi in the absence and presence of M. marinum infection. A A volcano plot of the signature set of lepb+ infected larvae compared to the lepb+ uninfected control. We used p < 0.05 and FC > 1.5 or FC < − 1.5 as cutoff values for all the figures. B A volcano plot of the signature set of lepbibl54 infected larvae compared to the lepbibl54 uninfected control. C A Venn diagram shows the number of differentially expressed genes (DEGs) in response to infection in the lepb+ and lepbibl54 larvae. D The FC and p value of the three groups of genes, shown in C, belonging to the two GO terms “response to bacterium” and “inflammatory responses”. E A volcano plot of the signature set of lepbibl54 compared to lepb+ larvae in the uninfected control situation. F A volcano plot of the signature set of lepbibl54 compared to lepb+ larvae in the infected situation. G A Venn diagram shows the number of DEGs between the lepbibl54 and lepb+ in the uninfected control and infected conditions. H The FC and p value of the three groups of genes, shown in G, belonging to the two GO terms