FIGURE SUMMARY
Title

Nitrate exposure reprograms hepatic amino acid and nutrient sensing pathways prior to exercise: A metabolomic and transcriptomic investigation in zebrafish (Danio rerio)

Authors
Keller, R.M., Beaver, L.M., Prater, M.C., Truong, L., Tanguay, R.L., Stevens, J.F., Hord, N.G.
Source
Full text @ Front Mol Biosci

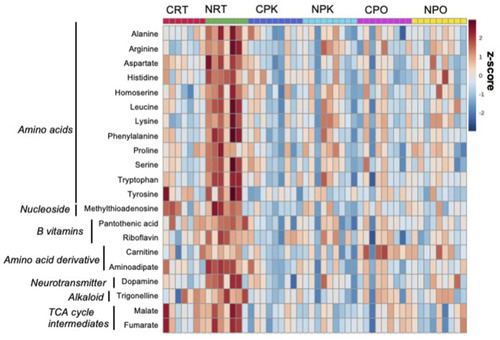
Nitrate treatment altered abundance of metabolites at rest, compared to control liver at rest. The metabolites were chosen based on top FDR-corrected p-values and physiological significance. Colors indicate z-score (standard deviation from the mean). The heat map was generated with MetaboAnalyst 5.0 using normalized data (log transformation, auto-scaling) using Euclidean distance measure (n = 7–9/group).

Metabolites related to NO homeostasis in zebrafish. Relative levels of metabolites metabolized by nitric oxide synthase (NOS), arginase (ARG) and xanthine oxidoreductase (XOR). Citrulline can also be recycled back to arginine. Asl, argininosuccinate lyase; Ass, argininosuccinate synthase. Labeled means without a common letter differ. (One-way ANOVA with Fisher’s post-hoc and Holm FDR-correction, p < 0.1 indicating significance, n = 7–9/group).

Nitrate exposure increased metabolites involved in amino acid metabolism, fatty acid metabolism, and the TCA cycle in liver. Labeled means without a common letter differ. (One-way ANOVA with Fisher’s post-hoc and Holm FDR-correction, p < 0.1 indicating significance, n = 7–9/group).

Nitrate exposure increased metabolites in the dopamine synthesis pathway. Labeled means without a common letter differ. (One-way ANOVA with Fisher’s post-hoc and Holm FDR-correction, p < 0.1 indicating significance, n = 7–9/group).

Expression of genes involved in liver energy metabolism and redox signaling resulting from nitrate treatment. The heat map was generated with Prism and color mapping represents the mean of each treatment group. Negative and positive values indicate downregulation and upregulation compared to control values, respectively. Asterisks indicate significance; *, p < 0.01; **, p < 0.001. (n = 6–8/group). hk1, hexokinase 1; fbp1a, fructose-1,6-bisphophatase a; ldha, lactate dehydrogenase a; g6pd, glucose-6-phosphate dehydrogenase; pnp5a, purine nucleoside phosphorylase 5a; ampd1, adenosine monophosphate 1; nrf2a, nuclear factor erythroid 2-related factor 2a; nrf2b, nuclear factor erythroid 2-related factor 2 b; nos2b, nitric oxide synthase 2b; pgc1a, peroxisome proliferator-activated receptor gamma coactivator 1-alpha; mtor, mammalian target of rapamycin; sirt3, sirtuin 3; cycs, cytochrome c oxidase; nmrk2, nicotinamide riboside kinase 2; acat1, acetyl-CoA acetyltransferase 1; acaca, acetyl-CoA carboxylase a; hmgcs1, 3-hydroxy-3-methylglutaryl-CoA synthase 1; hmgcl, 3-hydroxy-3-methylglutaryl-CoA lyase; cpt1b, carnitine palmitoyltransferase 1b; cpt2, carnitine palmitoyltransferase 2; bdh1, 3-hydroxybutyrate dehydrogenase; pparg, peroxisome proliferator activated receptor gamma; pparaa, peroxisome proliferator activated receptor alpha a isoform; pparab, peroxisome proliferator activated receptor alpha b

Acknowledgments
This image is the copyrighted work of the attributed author or publisher, and ZFIN has permission only to display this image to its users. Additional permissions should be obtained from the applicable author or publisher of the image. Full text @ Front Mol Biosci