
Image
|
Figure Caption
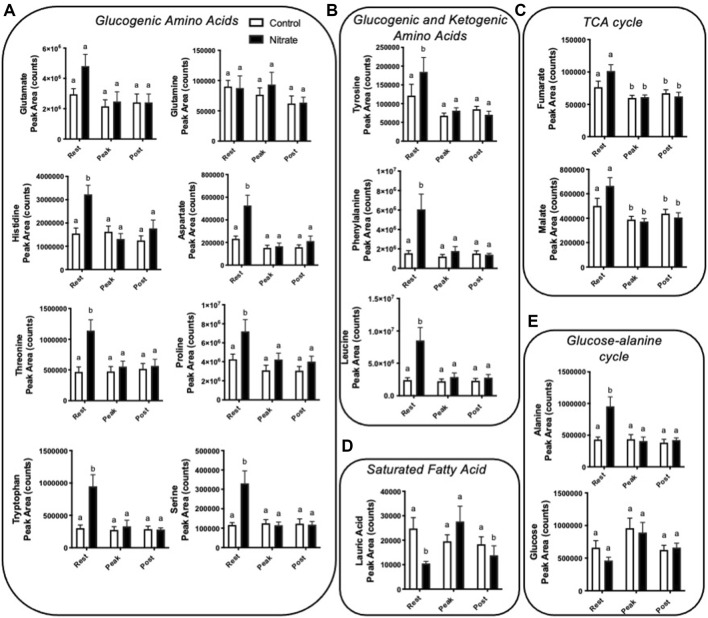
FIGURE 3
Nitrate exposure increased metabolites involved in amino acid metabolism, fatty acid metabolism, and the TCA cycle in liver. Labeled means without a common letter differ. (One-way ANOVA with Fisher’s post-hoc and Holm FDR-correction,
Acknowledgments
This image is the copyrighted work of the attributed author or publisher, and
ZFIN has permission only to display this image to its users.
Additional permissions should be obtained from the applicable author or publisher of the image.
Full text @ Front Mol Biosci