
- Title
-
Evolution and developmental expression of the sodium-iodide symporter (NIS, slc5a5) gene family: Implications for perchlorate toxicology
- Authors
- Petersen, A.M., Small, C.M., Yan, Y.L., Wilson, C., Batzel, P., Bremiller, R.A., Buck, C.L., von Hippel, F.A., Cresko, W.A., Postlethwait, J.H.
- Source
- Full text @ Evol. Appl.
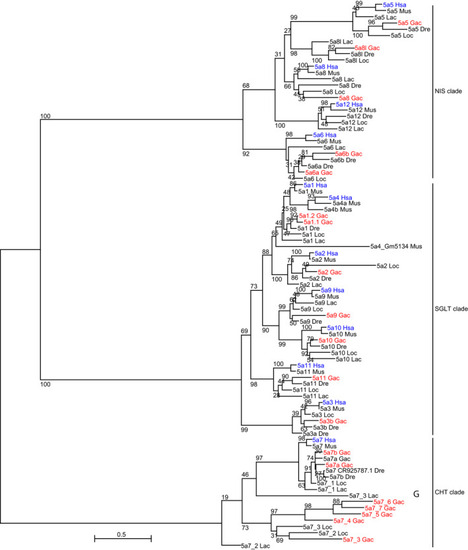
Maximum‐likelihood phylogenetic tree of Slc5a aligned amino acid sequences in representative vertebrate taxa. Phylogenetic analysis used a LG + G + F substitution model. A maximum‐likelihood tree inferred using PhyML (see Section |

Conserved synteny analysis of |
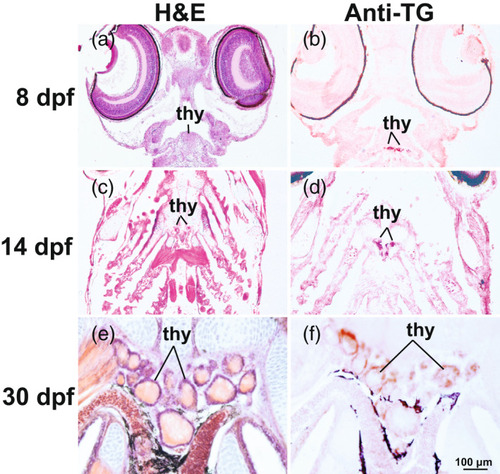
Colocalization of thyroid follicles and thyroglobulin protein at 8, 14, and 30 dpf in stickleback larvae. (a, c, e) Hematoxylin and eosin (H&E)‐stained horizontal sections of the pharynx showing thyroid follicles at 8–30 dpf. (b, d, f) Positive staining for thyroid antibody (anti‐TG [thyroglobulin]) is visible in and around the lumen of thyroid follicles at 8–30 dpf. Imaged at 400X. thy, thyroid follicles |

Expression patterns of |
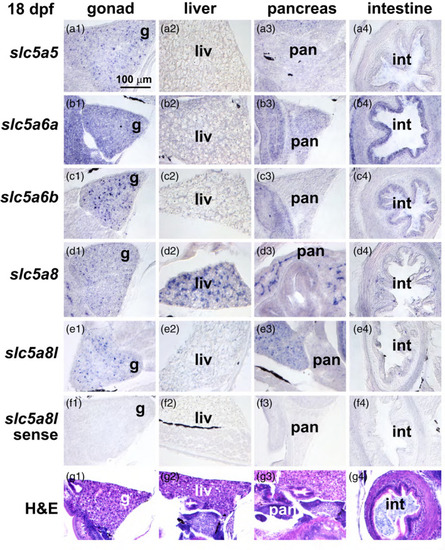
Expression patterns of |

Expression patterns of |

Expression of |
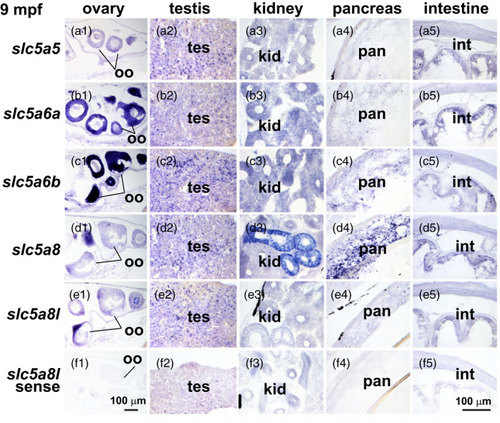
Expression of |

Single‐cell RNA‐seq analysis of 30 dpf zebrafish gonads. (a) tSNE plot with clusters numbered. Each dot represents a cell; (b) Cells from genetically female (red) and male (blue) gonads; (c) |