
- Title
-
A Primer Genetic Toolkit for Exploring Mitochondrial Biology and Disease Using Zebrafish
- Authors
- Sabharwal, A., Campbell, J.M., Schwab, T.L., WareJoncas, Z., Wishman, M.D., Ata, H., Liu, W., Ichino, N., Hunter, D.E., Bergren, J.D., Urban, M.D., Urban, R.M., Holmberg, S.R., Kar, B., Cook, A., Ding, Y., Xu, X., Clark, K.J., Ekker, S.C.
- Source
- Full text @ Genes (Basel)
|
|
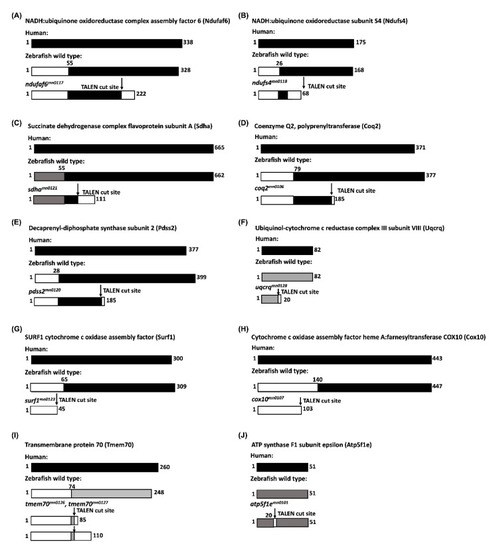
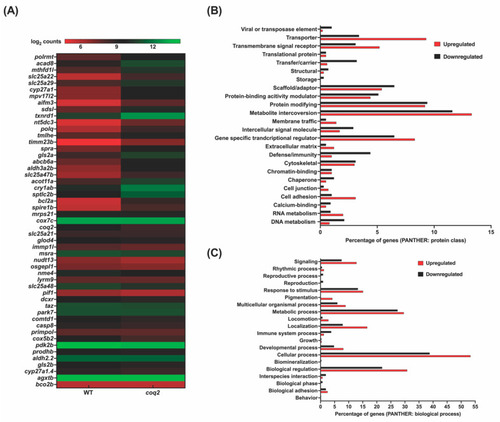
A depiction of homology of the mutants created for proteins involved in different mitochondrial resident pathways: ( |
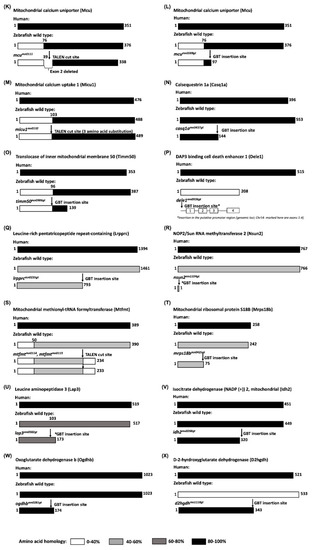
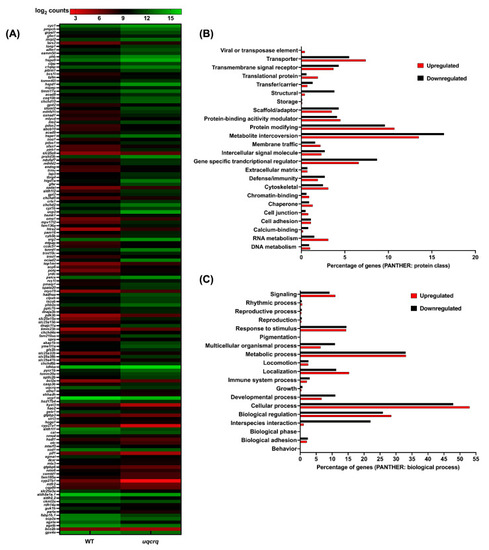
A depiction of homology of the mutants created for proteins involved in different mitochondrial resident pathways: ( |
|
|
|