
- Title
-
Cre/lox regulated conditional rescue and inactivation with zebrafish UFlip alleles generated by CRISPR-Cas9 targeted integration
- Authors
- Liu, F., Kambakam, S., Almeida, M.P., Ming, Z., Welker, J.M., Wierson, W.A., Schultz-Rogers, L.E., Ekker, S.C., Clark, K.J., Essner, J.J., McGrail, M.
- Source
- Full text @ Elife
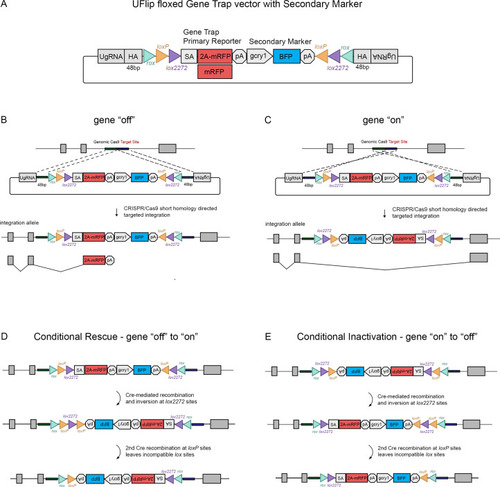
The UFlip floxed gene trap vector for isolation of conditional gene alleles generated by GeneWeld CRISPR-Cas9 targeted integration.
(A) Diagram of the UFlip. The vector contains a floxed rox loxP lox2272 gene trap plus secondary marker loxP lox2272 rox cassette. The cassette is flanked by cloning sites for homology arms (HA) complementary to a genomic CRISPR target site, and universal gRNA sites (UgRNA) for in vivo liberation of the targeting cassette. (B) Gene ‘off’ alleles are generated by integration of the UFlip cassette into an intron in the active orientation, leading to transcription termination and splicing of the primary transcript in the mRFP gene trap. (C) Gene ‘on” alleles are generated by integration of the UFlip cassette into an intron in the passive orientation. This is driven by cloning the genomic 5’ homology arm downstream of the UFlip cassette, and cloning the genomic 3’ homology arm upstream of the UFlip cassette. Integration at the genomic CRISPR-Cas9 target site occurs in the opposite orientation. During transcription RNA polymerase reads through the integrated UFlip cassette, which is spliced out with the intron during processing of the primary transcript. (D) Cre-mediated recombination at an ‘off’ allele locks the cassette in the ‘on’ orientation. The first recombination occurs stochastically at either lox2272 or loxP sites. The diagram shows the intermediate that forms if the first recombination occurs at the lox2272 sites. (E) Cre-mediated recombination at an ‘on’ allele locks the cassette in the ‘off’ orientation. The first recombination occurs stochastically at either lox2272 or loxP sites. The diagram shows the intermediate that forms if the first recombination occurs at the lox2272 sites. BFP, blue fluorescent protein; gcry1, gamma crystallin 1 promoter; myl7, cardiac myosin light chain 7 promoter; 2 A, porcine teschvirus-1 2A peptide; mRFP, monomeric red fluorescent protein; pA, transcription termination and polyadenylation signal; SA, splice acceptor. |
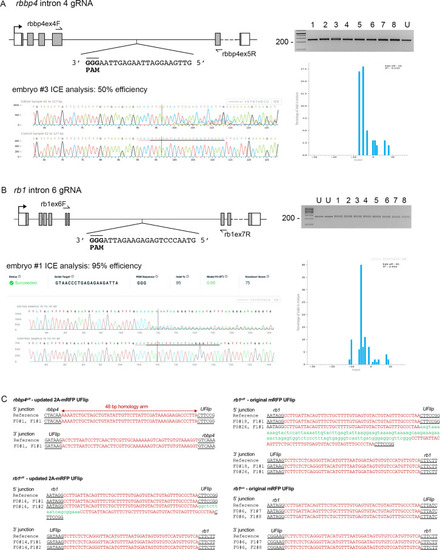
rbbp4 and rb1 intronic gRNA efficiency and F1 UFlip allele junction analysis.
(A) rbbp4 gene model with sequence of the intron 4 reverse strand gRNA. Gel image of PCR amplicons surrounding the target site from 8 Cas9 plus gRNA injected and 1 uninjected (U) embryo. Amplicons from embryo #3 and the uninjected embryo were sequenced and analyzed with Synthego’s ICE software, and indicate 50% indel efficiency at the target site. Plot shows the range and percentage of indels present in the sequences. PAM sequence shown in bold and underlined. (B) rb1 gene model with sequence of the intron 6 reverse strand gRNA. Gel image of PCR amplicons surrounding the target site from eight embryos injected with Cas9 and the gRNA (1-8), and two uninjected embryos (U). Amplicons from embryo #1 and an uninjected embryo were sequenced and analyzed with Synthego’s ICE software, and indicate 95% indel efficiency at the target site. Plots show the range and percentage of indels present in the sequences. PAM sequences shown in bold and underlined. (C) 5’ and 3’ genomic-UFlip integration junctions were PCR amplified from F1 transgenic zebrafish fin clip genomic DNA. The PCR products were sequenced and aligned to the reference sequence expected for a precise integration at the genomic target site. Capitalized red nucleotides represent 48 bp homology arms. Lowercase green nucleotides represent random inserted sequences. |
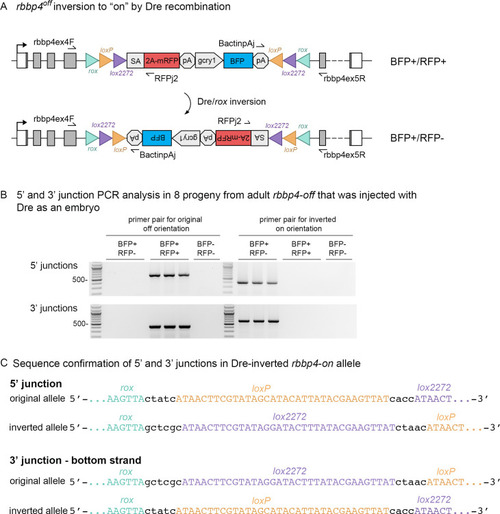
Dre mRNA injection into rbbp4off/+ embryos leads to inversion of the UFlip cassette and efficient germline recovery of an inverted rbbp4on allele.
(A) Diagram illustrating Dre-mediated inversion of the rbbp4off allele to the on orientation. Repeated inversion of the cassette will continue as long as Dre is present. The final allele is predicted to be in the inverted ‘on’ orientation at a frequency of 50%. (B) PCR junction analysis of 8 embryos from an F1 adult that had been injected with Dre mRNA at the one-cell stage. Three embryos positive for expression of the lens BFP secondary marker show the expected 5’ and 3’ junction PCR amplicons for the inverted rbbp4on allele. (C) Sequence analysis confirms Dre-mediated inversion of the cassette from the ‘off’ to ‘on’ orientation in BRP+/RFP - embryos. |
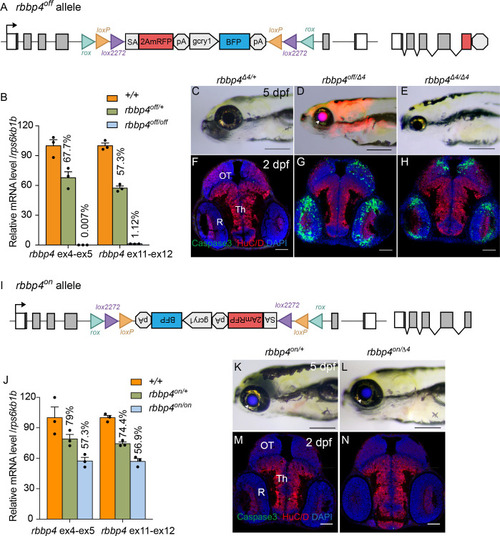
Molecular and phenotypic characterization of rbbp4off and rbbp4on alleles. (A) Diagram of the rbbp4off allele. (B) Plot of RT-qPCR results from wild type +/+ (n=3), heterozygous rbbp4off/+(n=3), and homozygous rbbp4off/off (n=3) larvae showing the relative level of rbbp4 mRNA transcript using reference gene rps6kb1b. Primer pairs were located in exons 4 and 5, or downstream exons 11 and 12. (C – E) Gross phenotype of rbbp4Δ4/+ (C), rbbp4off/Δ4 (D), and rbbp4Δ4/Δ4 (E) 5 dpf larvae. Arrowhead in (D) points to overlap of rbbp4off 2A-mRFP primary reporter and gcry1:BFP secondary reporter expression in the lens, which appears purple. (F – H) Caspase-3 and HuC/D labeling of sectioned head tissue from 2 dpf rbbp4Δ4/+ (F) rbbp4off/Δ4 (G) and rbbp4Δ4/Δ4 (H) embryos. (I) Diagram of the rbbp4on allele. (J) Plot of RT-qPCR results from wild type +/+ (n=3), heterozygous rbbp4on/+ (n=3), and homozygous rbbp4on/on (n=3) larvae showing the relative level of rbbp4 mRNA transcript using reference gene rps6kb1b. Primer pairs were located in exons 4 and 5, or downstream exons 11 and 12. (K, L) Gross phenotype of rbbp4on/+ (K) and rbbp4on/Δ4 (L) 5 dpf larvae. The rbbp4on allele secondary marker gcry1:BFP expression is visible in the lens. Caspase-3 and HuC/D labeling of sectioned head tissue from 2 dpf rbbp4Δ4/+ (M) and rbbp4off/Δ4 (N) embryos. OT, optic tectum; R, retina; Th, thalamic region. Error bars represent mean ± s.e.m. Scale bars: 200 μm (C–E, K, L), 50 μm (F–H, M,N).
|
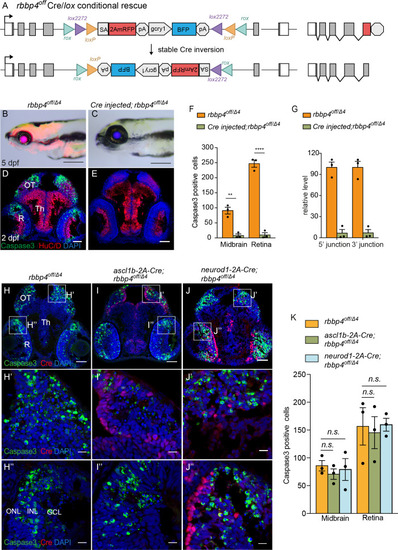
Ubiquitous and cell-type specific Cre-mediated conditional rescue with rbbp4-off. (A) Diagram of expected Cre mediated inversion of rbbp4off to on orientation. (B) Gross morphological phenotype of microcephaly and microphthalmia in 5 dpf transheterozygous rbbp4off/Δlarva. (C) Cre injected 5 dpf transheterozygous rbbp4off/Δ4larva shows rescue of gross phenotype and loss of mRFP expression. (D) Activated caspase-3a labeling throughout midbrain and retina section from 2 dpf transheterozygous rbbp4off/Δ4embryo. (E) Absence of activated caspase-3a labeling in midbrain and retina of 2 dpf transheterozygous rbbp4off/Δ4embryo after Cre injection. (F) Quantification of caspase-3a labeling in control rbbp4off/Δ4(n=3) and Cre injected rbbp4off/Δ4 (n=3) midbrain (** p<0.01) and retina (**** p<0.0001). (G) Genomic DNA qPCR quantification of rbbp4off original orientation 5’ and 3 junctions in control rbbp4off/Δ4 (n=3) and Cre injected rbbp4off/Δ4 (n=3). Cre injection reduced the level of rbbp4off original orientation 5’ (>93%) and 3’ junctions (>93%). (H – J”) Activated caspase-3A and Cre labeling in sectioned head tissue from 2 dpf rbbp4off/Δ4 (H-H"), ascl1b-2A-Cre; rbbp4off/Δ4 (I-I"), and neurod1-2A-Cre; rbbp4off/Δ4 (J-J") embryos. (K) Quantification of caspase-3a labeling in rbbp4off/Δ4(n=3), ascl1b-2A-Cre; rbbp4off/Δ4 (n=3) and neurod1-2A-Cre; rbbp4off/Δ4 (n=3).rbbp4off/Δ4vs. ascl1b-2A-Cre; rbbp4off/Δ4 midbrain (n.s. p=0.3248) and retina (n.s. p=0.8153), and neurod1-2A-Cre; rbbp4off/Δ4 midbrain (n.s. p=0.7794) and retina (n.s. p=0.9365). OT, optic tectum; R, retina; Th, thalamic region. Error bars represent mean ± s.e.m. with two-tailed t-test. Scale bars: 200 μm (B, C), 50 μm (D, E, H – J). 10 μm (H’ – J”).
|
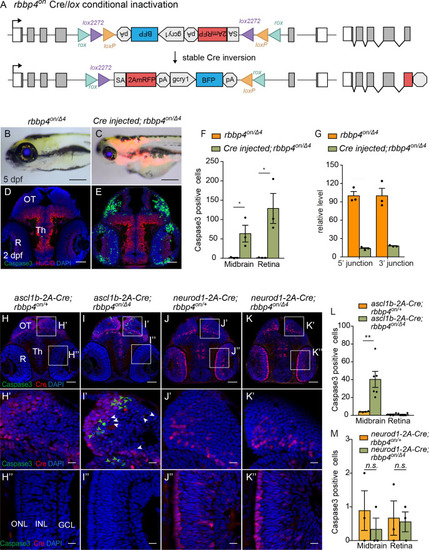
(A) Diagram of expected Cre-mediated inversion of rbbp4on to “off” orientation. (B) Normal morphological phenotype in 5 dpf transheterozygous rbbp4on/Δ4larva. (C) Induction of microcephaly and microphthalmia and mRFP expression in Cre injected 5 dpf transheterozygous rbbp4on/Δ4larva. (D) Absence of activated caspase-3a labeling in sectioned tissue from 2 dpf uninjected transheterozygous rbbp4on/Δ4embryo. (E) Activated caspase-3a labeling in the midbrain and retina of 2 dpf transheterozygous rbbp4on/Δ4embryo after Cre injection. (F) Quantification of caspase-3a labeling in control rbbp4on/Δ4(n=3) and Cre-injected rbbp4on/Δ4(n=3) midbrain (* p<0.05) and retina (* p<0.05). (G) Genomic DNA qPCR quantification of rbbp4on original orientation 5’ and 3 junctions in control rbbp4on (n=3) and Cre injected rbbp4on/Δ4 (n=3). (H – K”) Activated caspase-3a and Cre labeling in sectioned head tissue from 2 dpf ascl1b-2A-Cre; rbbp4D4/+ (H-H"), ascl1b-2A-Cre; rbbp4on/Δ4 (I-I"), neurod1-2A-Cre; rbbp4Δ4/+ (J-J"), and neurod1-2A-Cre; rbbp4on/Δ4 (K-K"), embryos. Green arrowheads, activated caspase-3a-positive cells. White arrowheads, hypercondensed and fragmented nuclei. (L) Quantification of caspase-3a labeling in ascl1b-2A-Cre; rbbp4on/+ (n=4) and ascl1b-2A-Cre; rbbp4on/Δ4 (n=6) midbrain (** p<0.01) and retina (n.s. p=0.8543). (M) Quantification of caspase-3a labeling in neurod1-2A-Cre; rbbp4on/+ (n=3) and neurod1-2A-Cre; rbbp4on/Δ4 (n=3) midbrain (n.s. p=0.3739) and retina (n.s. p=0.6433). OT, optic tectum; R, retina; Th, thalamic region. Error bars represent mean ± s.e.m. with two-tailed t-test. Scale bars: 200 μm (B, C), 50 μm (D, E, H – K). 10 μm (H’ – K”). |
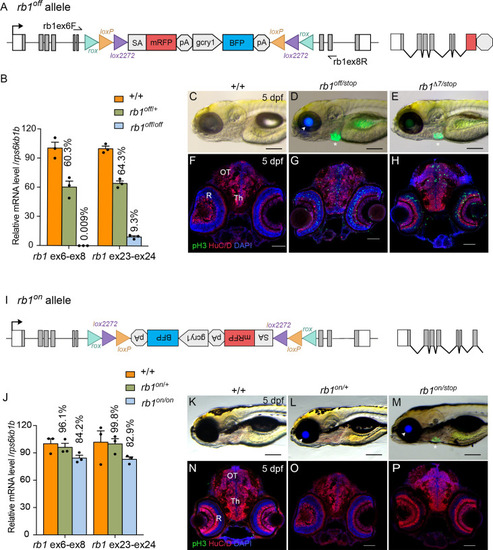
Molecular and phenotypic characterization of rb1off and rb1on alleles. (A) Diagram of the rb1off allele. (B) Plot of RT-qPCR results from wild type +/+ (n=3), heterozygous rb1off/+ (n=3), and homozygous rb1off/off (n=3) larvae showing the relative level of rb1 mRNA transcript using reference gene rps6kb1b. Primer pairs were located in exons 6 and 8, or downstream exons 23 and 24. (C – E) Gross phenotype of wildtype +/+ (C), rb1off/stop (D), and rb1Δ7/stop (E) 5 dpf larvae. Arrowhead in D points to rb1off allele gcry1:BFP secondary reporter expression in lens. Asterisk marks the rb1stop allele mly7:GFP secondary reporter expression in heart. (F – H) pH3 and HuC/D labeling of sectioned head tissue from 5 dpf +/+ (F), rb1off/stop (G), and rb1Δ7/stop (H). (I) Diagram of the rb1on allele. (J) Plot of RT-qPCR results from wild type +/+ (n=3), heterozygous rb1on/+ (n=3), and homozygous rb1on/on (n=3) larvae showing the relative level of rb1 mRNA transcript using reference gene rps6kb1b. Primer pairs were located in exons 6 and 8, or downstream exons 23 and 24. (K, L) Gross phenotype of wildtype +/+ (K), heterozygous rb1on/+ (L) and transheterozygous rb1on/stop (M) 5 dpf larvae. Arrowhead in L, M points to rb1off allele gcry1:BFP secondary reporter expression in lens. Asterisk in M marks the rb1stop allele mly7:GFP secondary reporter expression in heart. pH3 and HuC/D labeling of sectioned head tissue from 5 dpf +/+ (N), heterozygous rb1on/+ (O) and transheterozygous rb1on/stop (P).OT, optic tectum; R, retina; Th, thalamic region. Error bars represent mean ± s.e.m. Scale bars: 200 μm (C–E, K–M), 50 μm (F–H, N–P).
|
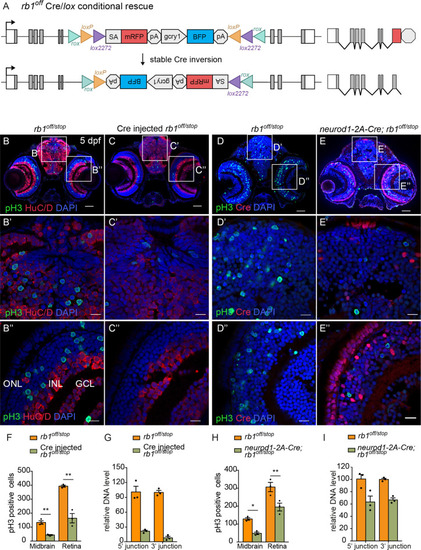
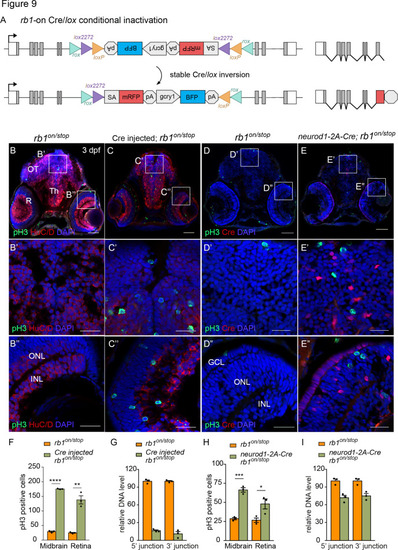
(A) Diagram of expected Cre-mediated inversion of rb1off to on orientation. (B, C) pH3 and HuC/D labeling of larval sectioned head tissue from 5 dpf transheterozygous rb1off/stop (B – B”) and Cre injected rb1off/stop (C – C”). (D, E) pH3 and Cre labeling of larval sectioned head tissue from 5 dpf transheterozygous rb1off/stop (D – D”) and neurod1-2A-Cre; rb1off/stop (E – E”). (F) Quantification of pH3-positive cells in control rb1off/stop (n=3) and Cre injected rb1off/stop (n=3) midbrain (** p<0.01) and retina (** p<0.01). (G) Genomic DNA qPCR quantification of rb1off original orientation DNA 5’ and 3’ junctions in control rb1off/stop (n=3) and Cre injected rb1off/stop (n=3). (H) Quantification of pH3-positive cells in rb1off/stop (n=3) and neurod1-2A-Cre; rb1off/stop (n=3) midbrain (** p<0.01) and retina (* p<0.05). (I) Genomic DNA qPCR quantification of rb1off original orientation DNA 5’ and 3’ junctions in control rb1off (n=3) and neurod1-2A-Cre; rb1off/stop (n=3). Error bars represent mean ± s.e.m. with two-tailed t-test. Scale bars: 50 μm (B - E), 10 μm (B’ – E”). |
(A) Diagram of expected Cre mediated inversion of rb1on to ‘off’ orientation. (B, C) pH3 and HuC/D labeling of larval sectioned head tissue from 5 dpf transheterozygous rb1on/stop (B – B”) and Cre injected rb1on/stop (C – C”). (D, E) pH3 and Cre labeling of larval sectioned head tissue from 5 dpf transheterozygous rb1on/stop (D – D”) and neurod1-2A-Cre; rb1on/stop (E – E”). (F) Quantification of pH3-positive cells in control rb1on/stop (n=3) and Cre rb1on/stop (n=3) injected midbrain (**** p<0.0001) and retina (** p<0.01). (G) Genomic DNA qPCR quantification of rb1onoriginal orientation DNA 5’ and 3’ junctions in control rb1on/stop (n=3) and Cre injected rb1on/stop (n=3). (H) Quantification of pH3-positive cells in control rb1on/stop (n=3) and neurod1-2A-Cre; rb1on/stop (n=3) midbrain (*** p<0.001) and retina (* p<0.05). (I) Genomic DNA qPCR quantification of rb1on original orientation DNA 5’ and 3’ junctions in control rb1on/stop (n=3) control and neurod1-2A-Cre; rb1on/stop (n=3). Error bars represent mean ± s.e.m. with two-tailed t-test. Scale bars: 50 μm (B - E), 20 μm (B’ – E”). |