
|
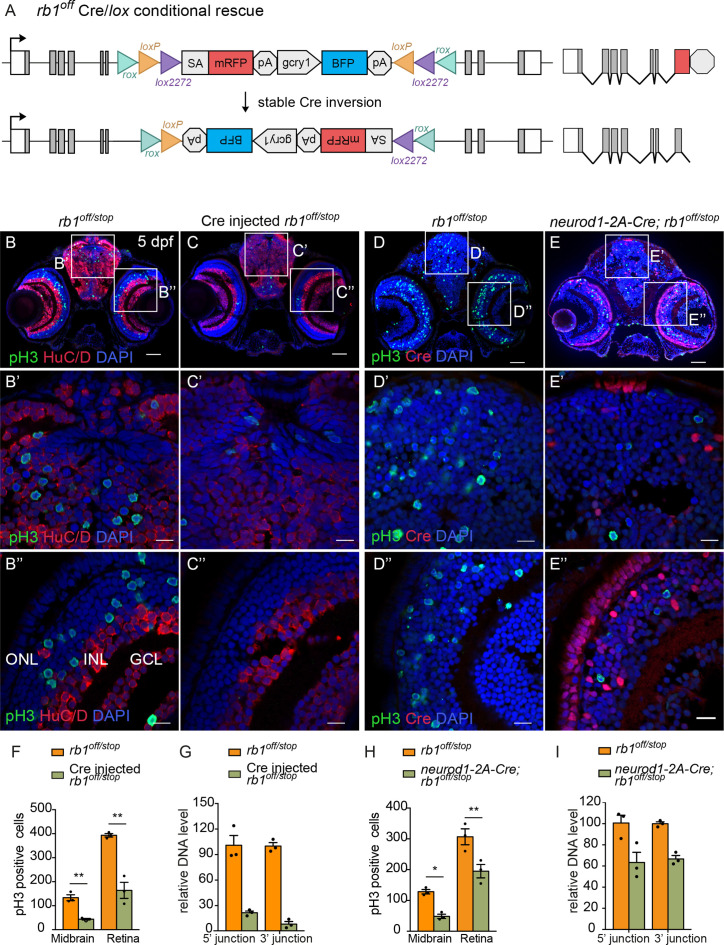
Fig. 8
(A) Diagram of expected Cre-mediated inversion of rb1off to on orientation. (B, C) pH3 and HuC/D labeling of larval sectioned head tissue from 5 dpf transheterozygous rb1off/stop (B – B”) and Cre injected rb1off/stop (C – C”). (D, E) pH3 and Cre labeling of larval sectioned head tissue from 5 dpf transheterozygous rb1off/stop (D – D”) and neurod1-2A-Cre; rb1off/stop (E – E”). (F) Quantification of pH3-positive cells in control rb1off/stop (n=3) and Cre injected rb1off/stop (n=3) midbrain (** p<0.01) and retina (** p<0.01). (G) Genomic DNA qPCR quantification of rb1off original orientation DNA 5’ and 3’ junctions in control rb1off/stop (n=3) and Cre injected rb1off/stop (n=3). (H) Quantification of pH3-positive cells in rb1off/stop (n=3) and neurod1-2A-Cre; rb1off/stop (n=3) midbrain (** p<0.01) and retina (* p<0.05). (I) Genomic DNA qPCR quantification of rb1off original orientation DNA 5’ and 3’ junctions in control rb1off (n=3) and neurod1-2A-Cre; rb1off/stop (n=3). Error bars represent mean ± s.e.m. with two-tailed t-test. Scale bars: 50 μm (B - E), 10 μm (B’ – E”).