
- Title
-
The regulation of heart rate following genetic deletion of the ß1 adrenergic receptor in larval zebrafish
- Authors
- Joyce, W., Pan, Y.K., Garvey, K., Saxena, V., Perry, S.F.
- Source
- Full text @ Acta Physiol. (Oxf).
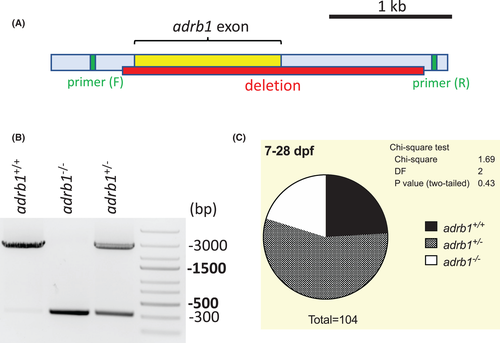
The generation and screening of an adrb1 knockout (adrb1−/−) zebrafish line. (A) Schematic illustration of the adrb1 gene within chromosome 12 including the single exon, the deleted segment (confirmed by Sanger sequencing), and sequencing primer targets. See Supplementary Material for annotated sequence. (B) Polymerase chain reaction with the sequencing primers generated a ~3000 bp wild-type band (adrb1+/+), a ~300 bp mutant band only (adrb1−/−) or both bands (adrb1+/−). (C) The results of F1 heterozygote (adrb1+/) incrosses generated offspring in the expected Mendelian ratio (compared with Chi-square test, p = 0.43; adrb1+/+ 24.04%, adrb1+/− 55.77%, adrb1−/− 20.19%). Note that this figure includes pooled data from the populations sampled at 7 and 28 dpf; for each subsample (age) see Figure S2.
|
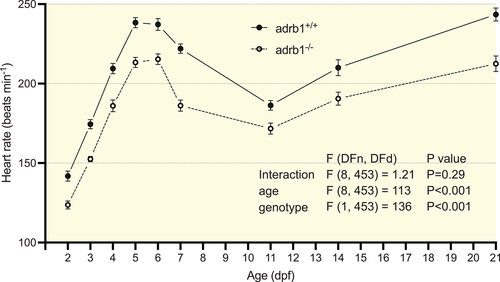
Heart rate during development in unanesthetized adrb1+/+ and adrb1−/− larvae. Heart rates were optically measured from 2–21 days post-fertilization (dpf). Each individual larva was used at only one time point. Statistical results show the output of a two-way ANOVA. N values were 16–55 at each time point. Data points show means ± SEM.
|
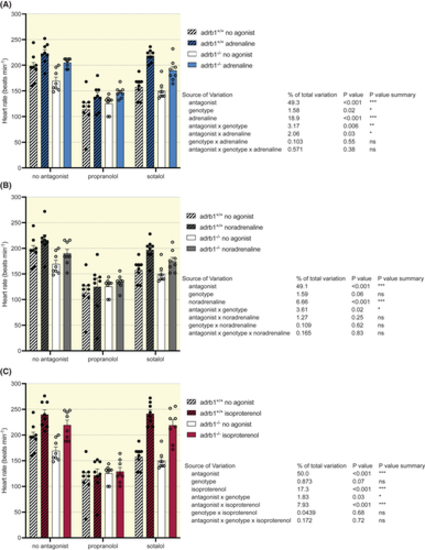
The effect of different adrenergic agonists (A, adrenaline; B, noradrenaline; C, isoproterenol) and general ß-AR antagonists (propranolol or sotalol) on heart rate in 7 dpf adrb1+/+ and adrb1−/− zebrafish larvae. All drugs were applied at a final concentration of 100 μM. The effects of each agonist were analyzed in separate three-way ANOVAs. Note that on each panel the “no agonist” bars (non-colored), including those with antagonists, are repeated to provide control data for comparison with a given agonist; all of the data were collected in the same sessions so the use of the same controls was appropriate. ns, p > 0.05; *p < 0.05; **p < 0.01, ***p < 0.001. N values are shown by individual data points. Bars show means ± SEM.
|
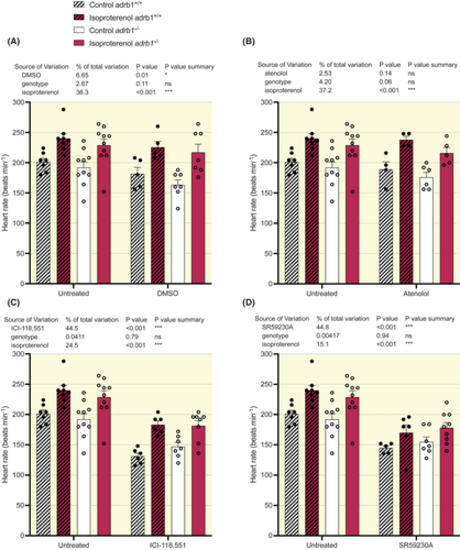
The effects of DMSO vehicle (A) and different adrenergic antagonists (B, atenolol, ß1-specific; C, ICI-118551, ß2-specific; D, SR59230A, ß3-specific) and the ß-AR agonist (isoproterenol) on heart rate in 7 dpf adrb1+/+ and adrb1−/− zebrafish larvae. All drugs, except SR59230A (10 μM) were applied at a final concentration of 100 μM. The effects of each antagonist were analyzed in separate three-way ANOVAs. Note that on each panel the four “untreated” bars (i.e., no antagonist) are repeated to provide control data for comparison with a given antagonist; all of the data were collected in the same sessions so the use of the same controls was appropriate. ns, p > 0.05; *p < 0.05; **p < 0.01, ***p < 0.001. N values are shown by individual data points. Bars show means ± SEM.
|
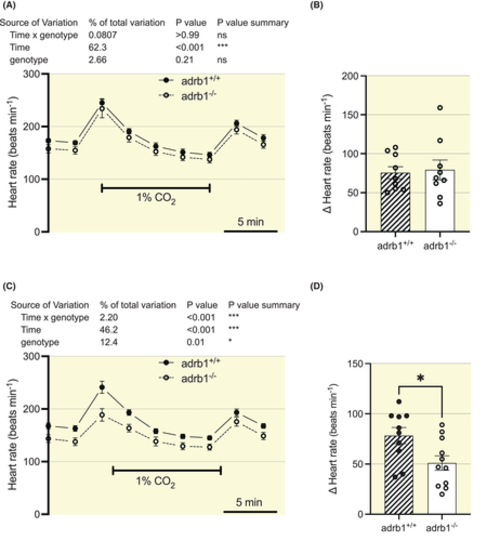
The effect of sustained hypercapnia (10 min) on heart rate in 5 (A, B) and 6 (C, D) dpf adrb1+/+ and adrb1−/− zebrafish larvae. Statistical results are the output of a repeated-measures two-way ANOVA (A, C). In panels B and D, the maximum changes in heart rate were calculated for each individual immediately after the onset of hypercapnia; genotypes were compared using unpaired t-test. ns, p > 0.05; *p < 0.05; **p < 0.01, ***p < 0.001. N = 9–11. Data points show means ± SEM (A, C), bars show means ± SEM and individual points (B, D).
|
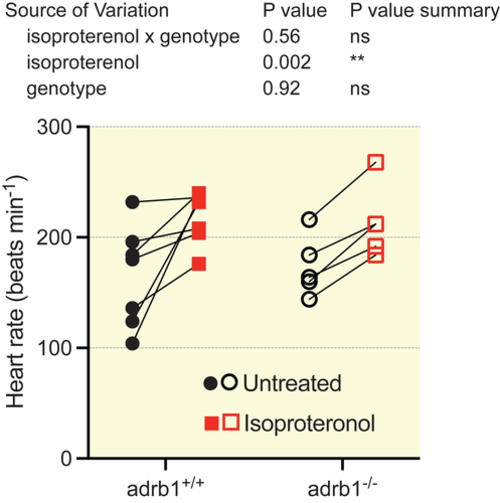
The effect of isoproterenol (final concentration 1 μM) on heart rate in spontaneously-beating isolated hearts from adrb1+/+ and adrb1−/− adult (3 months post-fertilization) zebrafish. Statistical results are the output of a repeated-measures two-way ANOVA. ns, p > 0.05; *p < 0.05; **p < 0.01, ***p < 0.001. N = 5–7. Data are presented as individual data points.
|
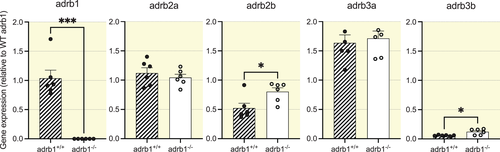
Expression of five adrb genes in 7 dpf adrb1+/+ and adrb1−/− zebrafish hearts analyzed with qPCR. Statistical comparisons made with unpaired t-test. *p < 0.05; ***p < 0.001. For each sample N = 6 pools of 20 hearts. Bars show means ± SEM and individual data points.
|
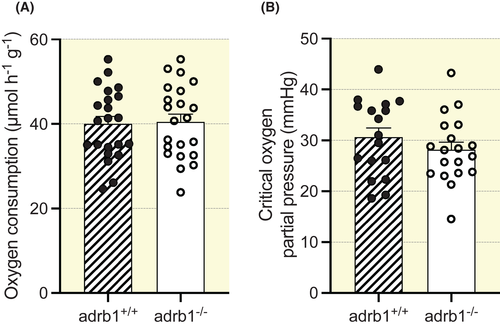
Routine oxygen consumption (A) and critical oxygen partial pressure (Pcrit; B) in adrb1+/+ and adrb1−/− zebrafish determined with respirometry. Oxygen consumption measurements N = 22, successful Pcrit measurements N = 17–19. There were no significant differences in either parameter between genotypes. Bars show means ± SEM and individual data points.
|