
- Title
-
Glucose uptake as an alternative to oxygen uptake for assessing metabolic rate in Danio rerio larvae
- Authors
- Evans, B.L., Hurlstone, A.F.L., Clayton, P.E., Stevens, A., Shiels, H.A.
- Source
- Full text @ Curr Res Physiol

Fig. 1. Stop-flow respirometry setup for larval fish. 1. Temperature meter. 2. AquaResp-controlled USB switch. 3. Recirculation tank. 4. Stop-flow pump controlled by USB switch. 5. Water heater (28°C). 6. Respirometry chamber. 7. Oxygen spot. 8. Fibreoptic probe. 9. Recirculation pump. 10. Air stone. 11. Temperature probe. 12. FireStingO2 Oxygen and Temperature Logger. 13. AquaResp software v.3. Larvae (14.) are placed in the respirometry chamber and acclimated for 1 h before measurements begin. AquaResp controls the stop-flow pump and logger to cycle through a series of flush-wait-measure steps (60 s, 10 s, 300 s), generating oxygen saturation curves. AquaResp generates regression curves and outputs MO2 data for each cycle. |
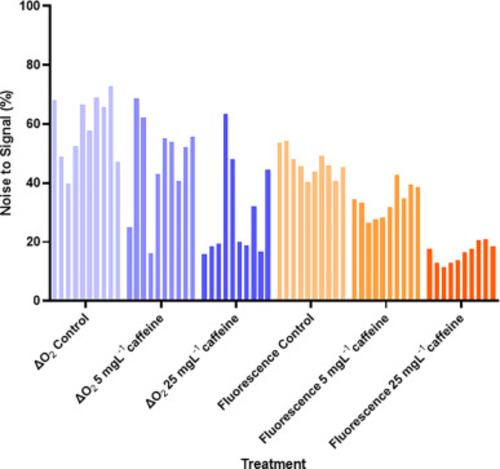
Supplementary Figure 1: Noise to signal plot for the stop-flow respirometry and glucose uptake methods. Data are presented for each individual larvae as the noise as a percentage of the total signal. In the case of stop-flow respirometry, the background respiration represents noise. In the case of glucose uptake, the average fluorescent signal from the sham-injected larvae represents the noise. |
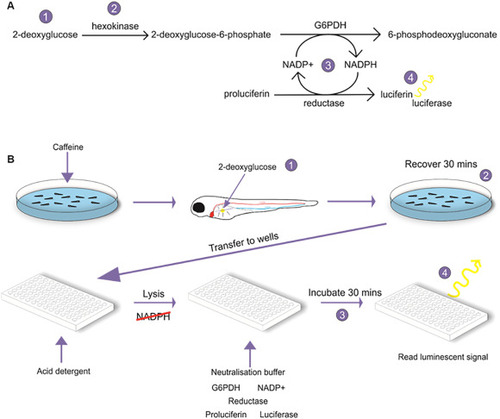
Figure 2. Glucose uptake assay protocol. 2a. Equation detailing the reactions involved in a glucose uptake assay. 2b. Experimental setup of a glucose assay performed on 96 hpf zebrafish larvae exposed to different concentrations of caffeine. Larvae are injected with 2-deoxyglucose into the yolk (yellow area) and recovered for 30 min. Larvae are transferred to individual wells and lysed with acid detergent to stop further glucose uptake, destroy any native NADPH, and homogenise the sample. Neutralisation and detection buffer are added, and samples are incubated while the luminescent signal is generated. After 30 min, luminescence is measured on a plate reader. |

Figure 3. Comparison of metabolic rate as measured by stop-flow respirometry (3a) and glucose uptake (3b), Passing-Bablok comparison of the two methods (3c) with associated precision plot (3d) and Bland-Altman residuals plot (3e). 96 hpf zebrafish larvae were incubated in one of three caffeine concentrations (0 mg L-1, 5 mg L-1, and 25 mg L-1) to generate groups with differing metabolic rates. 3a. Oxygen uptake was measured by stop-flow respirometry in nanograms of oxygen per minute per larvae (n = 10). There was a significant increase in oxygen consumption between control and caffeine treated zebrafish larvae, with oxygen uptake increasing with increasing concentrations of caffeine (*** = 0.0006. **** <0.0001). 3b. The rate of cellular glucose accumulation was measured using a Glucose-Uptake GloTM Assay. There was a significant increase in luminescence between control and caffeine treated zebrafish larvae, with higher levels of luminescence correlating with higher concentrations of caffeine (**** <0.0001). All data are represented as individual data points with mean and SEM bars. Significance was determined by one-way ANOVA. 3c. Passing-Bablok Regression of respirometry versus scaled glucose uptake assay data, including regression line, identity line, and 95% confidence limits (grey shaded area). y = 1.02x −0.18, 95% confidence intervals −1.018 ≤ α ≤ 0.89 and 0.97 ≤ β ≤ 1.33. 3d. Precision plot comparing the two methods over the given range. Respirometry is marginally more precise at lower metabolic rates, while the Glucose Uptake Assay became increasingly more precise compared to respirometry as metabolic rate increased. 3e. Bland-Altman plot of the residuals. Bias = −0.64 (purple). Upper limit of agreement = 2.48 (green), lower limit of agreement = −3.77 (pink). Upper 95% confidence interval = 3.51, lower 95% confidence interval = −4.79. |