
Image
|
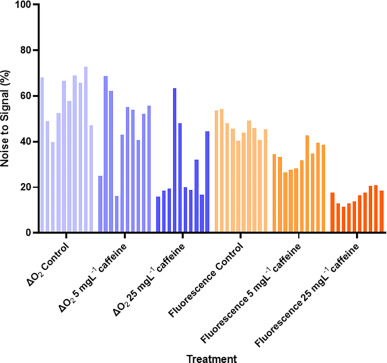
Figure Caption
Fig. 1 Supplementary Supplementary Figure 1: Noise to signal plot for the stop-flow respirometry and glucose uptake methods. Data are presented for each individual larvae as the noise as a percentage of the total signal. In the case of stop-flow respirometry, the background respiration represents noise. In the case of glucose uptake, the average fluorescent signal from the sham-injected larvae represents the noise.
Acknowledgments
This image is the copyrighted work of the attributed author or publisher, and
ZFIN has permission only to display this image to its users.
Additional permissions should be obtained from the applicable author or publisher of the image.
Full text @ Curr Res Physiol