
FIGURE SUMMARY
- Title
-
Expression Pattern of nos1 in the Developing Nervous System of Ray-Finned Fish
- Authors
- Annona, G., Ferran, J.L., De Luca, P., Conte, I., Postlethwait, J.H., D'Aniello, S.
- Source
- Full text @ Genes (Basel)

Figure 1. Expression of nos1 during zebrafish development. At 24 hpf, nos1 expression appeared in pallial and subpallial telencephalic territories, in the alar hypothalamus, and in epidermis (A,B). At 48 hpf, nos1 signal emerged in the telencephalon, in the dorsal portion of the hypothalamus, the basal plate of prosomeres 1 to 3, and in the midbrain and rhombencephalon (C,D). At 72 hpf, the olfactory bulbs, the pallium in the telencephalon, the basal plate of prosomeres p1-p3, and the midbrain, cerebellum and rhombencephalon were positively marked (E,F). At 96 hpf, nos1 transcripts were detected in the telencephalon, hypothalamus, diencephalon proper, midbrain, cerebellum, rhombencephalon, eye, and gut (G,H). Abbreviations: ah, alar hypothalamus; c, cerebellum; d, diencephalon; e, eye; g, gut; h, hypothalamus; ha, alar hypothalamus; p1/p3/m, basal plate of prosomere 1 to 3 and midbrain; ep, epidermis; lc, locus coeruleus; ob, olfactory bulbs; r, rhombencephalon; t, telencephalon. DV dorsal view; VV, ventral view; LV, lateral view. Scale bar: 500 µm.
|
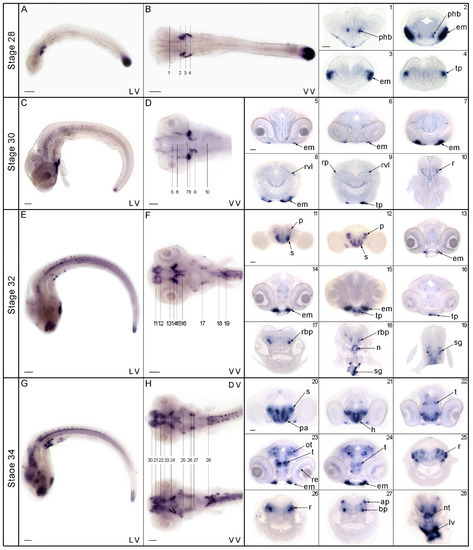
Figure 2. Expression of nos1 in medaka embryos and larvae. At stage 28, whole-mount in situ hybridization experiments displayed positive cells in the rostral portion of the nervous system and in the tailbud (A,B). At this stage, sections showed signal around the diencephalon-hypothalamus boundary (1–2), in the extraocular muscle (2–3), and caudally in the thyroid primordium (4). At stage 30 (C,D), expression was retained in the extraocular muscle and thyroid primordium, (5 to 9) and nos1-positive cells were detected in ventricular layer cells of the rhombencephalon (8–9), between the alar and basal plate (9), and in the rhombencephalic area (10). At stage 32 (E,F), nos1 was expressed in the subpallial and pallial region (11–12), in the extraocular muscle (13–15), and the thyroid primordium (15–16). Caudally, nos1 signal was present in the rhombencephalon (17–18), notochord, and sympathetic ganglia (18–19). At stage 34 (G,H), hybridization signal was present in the subpallium, preoptic area, hypothalamic domains, thalamus, optic tectum, eye and extraocular muscle (21 to 25), basal and alar plate of the rhombencephalon (26 to 28), notochord, and liver primordium (28). Abbreviations: ap, alar plate; bp, basal plate; phb, prethalamus-hypothalamus boundary; em, extraocular muscles: tp, thyroid primordium; h, hypothalamus; lv, liver; n, notochord; ot, optic tectum; pn, pallium nuclei; r, rhombencephalon; rbp, rhombencephalic basal plate; re, retina; rp, rhombencephalic plate; rvl, rhombencephalic ventricular layer; s, subpallium; sg, sympathetic ganglia; t, thalamus; tp, thyroid primordium. DV dorsal view; VV, ventral view; LV lateral view. Scale bar: whole-mount 100 µm; sections 250 µm.
|

Figure 3. Expression patterns of nos1 in spotted gar embryos (4-6-9 dpf). At 4 dpf, nos1-positive cells were localized in the rhombencephalon (A–D) in the 4th ventricle (C) and in the tuberal/retrotuberal region (D,D’). At 6 dpf, nos1 expression localized in the rhombencephalon and the hypothalamic domain (E,F,J), the basal plate of the diencephalon proper p1-p3 (F,G), the trigeminal ganglia, in the primordium of the ciliary body/iris in the eye (G), ventrally in the tuberal/retrotuberal region (H,I), and the thalamic area (I). At 9 dpf, nos1 expression was detectable in the basal plate of the mesencephalon (K–O), the rhombencephalon (L,M,O), the tuberal/retrotuberal region of the hypothalamus and retina (M–O), and the trigeminal ganglia (N–P). Abbreviations: br, basal rhombencephalon; cb, ciliary body; har, hypothalamic acroterminal region; hd, hypothalamic domain; i, iris; lbr, latero-basal rhombencephalon; mbp, mesencephalic basal plate; p1/p3, basal plate of prosomere 1 to 3; rab, rhombencephalic alar basal boundary; rbp, rhombencephalic basal plate; re, retina; ta, thalamic area; tr, tuberal region; tg, trigeminal ganglia. Scale bar: 100 µm.
|
Acknowledgments
This image is the copyrighted work of the attributed author or publisher, and
ZFIN has permission only to display this image to its users.
Additional permissions should be obtained from the applicable author or publisher of the image.
Full text @ Genes (Basel)