
- Title
-
Identifying drivers of breast cancer metastasis in progressively invasive subpopulations of zebrafish-xenografted MDA-MB-231
- Authors
- Xiao, J., McGill, J.R., Nasir, A., Lekan, A., Johnson, B., Wilkins, D.J., Pearson, G.W., Tanner, K., Goodarzi, H., Glasgow, E., Schlegel, R., Agarwal, S.
- Source
- Full text @ Mol Biomed
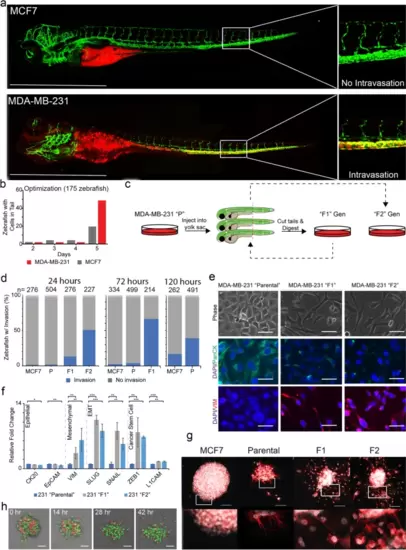
Labeled MDA-MB-231 cells were injected into the yolk sac of 2-days post fertilized zebrafish embryos and monitored for invasion. a Injection of MCF7 and MDA-MB-231 cells into the yolk sac resulted in cell arrest within the caudal plexus. Images of zebrafish were taken at 4x magnification using Olympus IX-71 inverted fluorescence microscope. b Transiently labeled cells arrest within the tail of the zebrafish within 5 days of injection. c Workflow of serial transplantation of the MDA-MB-231 heterogeneous parental population to generate the F1 and F2 subpopulations. d MDA-MB-231 F1, and F2 cells arrest within the tails of zebrafish progressively faster. Three separate experiments evaluating the parental (“P”), F1, and F2 ability to invade over three time points (120, 72, and 24 hours). Xenografted parental, F1, and F2 cells appeared in ≥40% of injected zebrafish in 120, 72, and 24 hours, respectively. e Phase and immunofluorescence images of resulting in vitro cultured MDA-MB-231 parental, F1, and F2 cells. f qRT-PCR amplification of epithelial (CK20, EpCAM), mesenchymal (VIM), EMT TFs (SLUG, SNAIL), and cancer stem cell markers (ZEB1, L1CAM) was performed of the three subpopulations. Relative fold changes were normalized to MDA-MB-231 parental cells. * = p-value < .05; ** = p-value < .001; *** = p-value < .0001 (g) Clusters of MCF7, MDA-MB-231 parental, F1, and F2 cells were embedded within a 3-dimensional Matrigel-based extracellular matrix and allowed to invade over 24 hours. Clusters were stained for nuclei (white) and phalloidin (red). h RFP-labeled F2 and GFP-labeled parental cells were co-clustered and embedded in 3D ECM showing F2 cells invade the ECM progressively with time, but not parental cells. Scale bars = 100 μm EXPRESSION / LABELING:
|
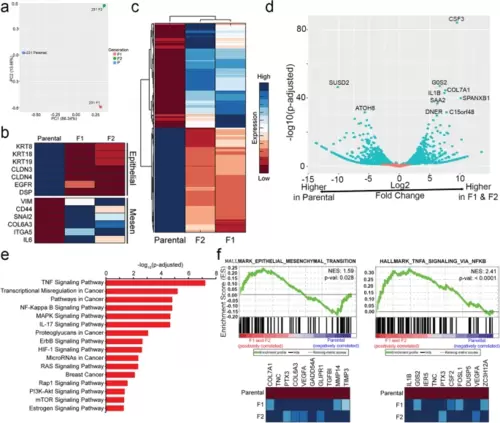
RNA-sequencing of MDA-MB-231 parental, F1, and F2 populations reveals increased expression of EMT genes and metastasis-associated genes in F1/F2 compared to parental cell populations. a Principal-component analysis reveals transcriptomic differences between all three subpopulations. b A heatmap depicting RNA-sequencing expression of a select panel of epithelial and mesenchymal markers is shown. c A clustergram of the overall transcriptomic landscape of the parental, F1, and F2 populations. d A volcano plot depicting the most significantly upregulated and downregulated genes when comparing the F1 and F2 populations relative to the common parental control. e A KEGG analysis was performed, revealing enrichment of several important cancer-associated pathways in the F1 and F2 populations. f GSEA analysis identified enrichment of the hallmarks gene set Epithelial-Mesenchymal Transition and TNFα Signaling via NF-kβ, among other gene sets |
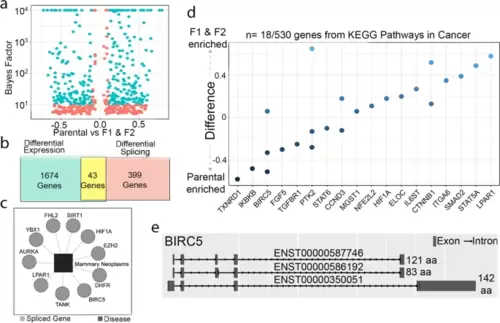
Differential RNA-splicing and protein-protein interactions associated with cancer and metastasis were enriched in the F1 and F2 populations compared to parental population. a A volcano plot of the 526 differentially spliced transcripts. b Overall, 43 genes were both significantly differentially expressed and differentially spliced. c Gene-disease association analysis using DisGeNET revealed differentially spliced genes associated with mammary neoplasms. d KEGG pathway analysis identified differentially spliced genes included within the Pathways in Cancer geneset. e BIRC5 was one of the few genes that was both differentially expressed and differentially spliced. The three spliced variants of BIRC5 differentially spliced in the F1 and F2 populations are shown |
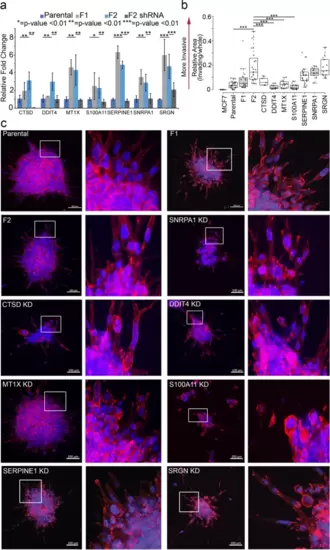
Knock-down of DDIT4, MT1X, SERPINE1 and CTSD in MDA-MB-231 F2 cells revealed a role in breast cancer invasion. a qRT-PCR amplification quantifying knockdown of the respective gene within the MDA-MB-231 F2 population. Notably, expression of all genes was reduced to near parental expression levels. b After 24 hours, ECM embedded cell clusters of various knockdown and wildtype lines were quantified using ImageJ for invasion. Invasion is measured as relative area of cells that escape the cluster. c Representative immunofluorescence images (left panel of each pair) of embedded clusters stained for Hoechst (blue) and Phalloidin (red). Digitally zoomed insets taken from the full-sized image and highlighting invasion at the borders are provided (right panel of each pair). Insets correspond to dashed boxes on original scale image. Scale bars = 100 μm. * = p-value < .01; ** = p-value < .001; *** = p-value < .0001 |