
- Title
-
FMNL2 regulates gliovascular interactions and is associated with vascular risk factors and cerebrovascular pathology in Alzheimer's disease
- Authors
- Lee, A.J., Raghavan, N.S., Bhattarai, P., Siddiqui, T., Sariya, S., Reyes-Dumeyer, D., Flowers, X.E., Cardoso, S.A.L., De Jager, P.L., Bennett, D.A., Schneider, J.A., Menon, V., Wang, Y., Lantigua, R.A., Medrano, M., Rivera, D., Jiménez-Velázquez, I.Z., Kukull, W.A., Brickman, A.M., Manly, J.J., Tosto, G., Kizil, C., Vardarajan, B.N., Mayeux, R.
- Source
- Full text @ Acta Neuropathol.
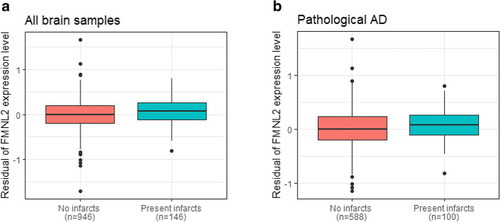
FMNL2 expression level by brain infarcts. a Distribution of expression level of FMNL2 in those with gross chronic infarction in cortex compared to those without infarction was statistically significant (adjusted for age, sex, and processing factors b = 1.024, pFDR = 0.003). b Distribution of FMNL2 expression in those with pathological AD and gross chronic infarction in cortex compared to those with pathological AD and no infarction, in the dorsolateral prefrontal cortex from ROSMAP was statistically significant (adjusted b = 0.792, p = 0.025). A logistic regression was fitted for the brain infarcts as outcome and FMNL2 expression level (log2-tranformed normalized transcripts per million values) as exposure adjusted for age, sex, and processing factors. For visualization purposes, the residual of FMNL2 expression level (y-axis) was used to represent the residual of transcripts from fitting the linear regression on the FMNL2 expression level adjusted for age, sex, and processing factors, capturing variability in transcripts outcome not captured by known demographics or processing factors |
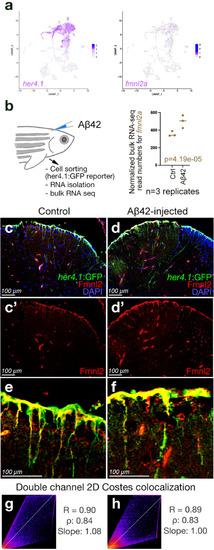
Expression of fmnl2a in zebrafish brain overlaps with astroglia. a Singe cell sequencing tSNE plots for her4.1 and fmnl2a in adult zebrafish telencephalon. b Amyloid toxicity assay and bulk RNA sequencing results for fmnl2a gene expression. c, d Double immunohistochemical staining (dIHCs) for her4.1: GFP (astroglia) and Fmnl2 in control (c) and amyloid-injected (d) brains with DAPI counterstain. c′, d′ individual fluorescent channels for Fmnl2. e, f Higher magnification image showing overlapping Fmnl2 and her4.1-driven GFP. g, h Double channel colocalization analyses of e and f. R Pearson correlation coefficient, ρ Spearmann’s rank coefficient. Scale bars as indicated |
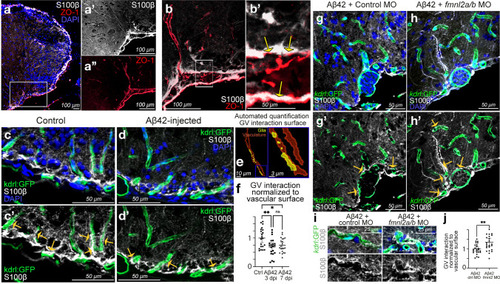
Fmnl2 is required for remodeling of gliovascular interactions. a dIHCs for S100β (astroglia) and ZO-1 (tight junctions/vessels) with DAPI counterstain. a′, a′′ Individual channels for the inset in a. b Higher magnification view of dorsoventral gliovascular (GV) junctions. b′ Close-up of inset in b. Arrows indicate overlaps. c, d dIHCs for kdrl:GFP (blood vessels) and S100β in control (c) and amyloid-injected (d) brains with DAPI counterstain. c′, d′ DAPI omitted from c and d. e Representative snapshot of the automated quantification of the surface of gliovascular interactions. f Quantification results of GV interactions. g, h dIHCs for kdrl:GFP and S100β in amyloid injected brains that were co-injected with control morpholino (g) and fmnl2a/b morpholino (h) with DAPI counterstain. g′, h′ DAPI omitted from g and h. i Close-up image of blood vessels interacting with glial endfeet. j Quantification results of GV interactions. Yellow arrows in c′, d′, g′ and h′ indicate exemplary gliovascular interactions. Scale bars as indicated |
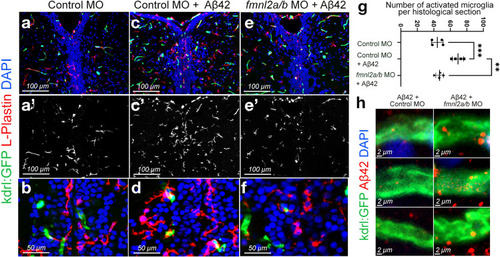
Fmnl2 knock-down reduces the number of activated microglia and alters the amyloid load. a–f dIHCs for L-plastin (microglia) and kdrl:GFP with DAPI counterstain on control morpholino (a, b), Aβ42+ control morpholino (c, d), and Aβ42+ fmnl2a/b morpholino (e, f) injected brains. a′, b′, c′ L-plastin channel alone. g Quantification graph for the number of activated microglia in the indicated conditions. h High magnification images from three blood vessels in Aβ42+ control morpholino-injected zebrafish brains (left column) and Aβ42+ fmnl2a/b morpholino-injected brains (right column). Scale bars as indicated |

Upregulated Fmnl2 and altered gliovascular interactions observed in chronic APP/PS1dE9 AD model in mice. a, h Triple immunohistochemical stainings (tIHC) for Gfap (astroglia), 4G8 (amyloid plaques) and Fmnl2 with DAPI counterstain in control (a, d) and APP/PS1dE9 mice (e–h) at 12 months of age. Panels are from cerebral cortex. Black-white panels are individual fluorescence channels of the composite images in a and e. i–p tIHC for Gfap, Cd31 (blood vessel) and Fmnl2 with DAPI counterstain in control (i–l) and APP/PS1dE9 mice (m–p) at 12 months of age. Panels are from cerebral cortex. Black-white panels are individual fluorescence channels of the composite images in i and m. Scale bars as indicated |
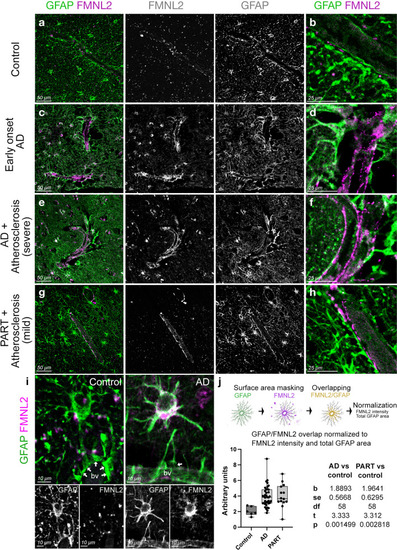
FMNL2 expression is upregulated at gliovascular junctions in AD patients. a–h dIHC for FMNL2 and GFAP in control (a, b), early onset AD patient (c, d), AD patient with severe atherosclerosis (e, f), and primary age-related Tauopathy (PART) with mild atherosclerosis patient (g, h). Black and white images are individual fluorescent channels of the leftmost panels for FMNL2 and GFAP. Rightmost panels (b, d, f, h) are higher-magnification composite images around a representative blood vessel. i Two examples of astroglia (GFAP+, green) contacting blood vessels (bv), and their expression of FMNL2 (violet). Arrows indicate contact with blood vessels. In AD, astroglia express FMNL2 and its endfeet is retracted from the blood vessel, while in controls tight association is observed. Black-white panels indicate individual fluorescence channels. j Arivis-based automated image quantification pipeline and the quantification graph for FMNL2 expression in human brains. Comparisons are for every diseased brain to control. with Dunn's Kruskal–Wallis test. Scale bars as indicated |