
- Title
-
Anomalous diffusion and asymmetric tempering memory in neutrophil chemotaxis
- Authors
- Dieterich, P., Lindemann, O., Moskopp, M.L., Tauzin, S., Huttenlocher, A., Klages, R., Chechkin, A., Schwab, A.
- Source
- Full text @ PLoS Comput. Biol.

(A)—(D) Paths of individual cells are normalized to a common starting point at the origin of the coordinate system. They are derived from different experimental conditions. Murine neutrophils were observed with a sampling interval of dt = 5 s over a time period of T = 30 min. Final cell positions are marked by colored circles (A-D). The black line indicates the mean position of the corresponding cell ensemble over the observation period T. The mean squared displacement of the cell ensemble after observation time T is represented as a red ellipse. The size of the ellipse indicates different propagation of cells in x- and y-direction. Murine neutrophils are chemotacting in a CLCX1 gradient along the positive y-axis. (A) Wildtype cells (WT). (B) Wildtype cells in the presence of the CXCR2 antagonist SB225002 (WT + SB). (C) TRPC6-knockout cells (TRPC6−/−). (D) TRCP6-knockout cells in the presence of CXCR2 antagonist SB225002 (TRPC6−/− + SB). |

(A), (B) and (C), (D) show the first and second moments of wildtype neutrophils with respect to x- and y-direction, respectively. Thin grey lines indicate time-averaged moments of single cells according to Eqs 16 and 17. The thick green lines show the time-ensemble-average of the corresponding moment according to Eqs 18 and 19. (E) compares the mean first moment of different experimental conditions with murine neutrophils. (F) shows the differences of the second moments, i.e. the mean squared displacement for murine neutrophils. |

Fig 3. Velocity autocorrelation functions. The diagrams show the velocity autocorrelations in x- and y-direction. Thick colored lines indicate the corresponding time-ensemble-averaged velocity autocorrelation function 〈vcorr,x|y(t)〉 as defined in Eq 22 with repect to x- and y-direction in bright and dark colors, respectively. The results of the best theoretical model are shown as black lines together with a grey area of uncertainty (± one standard deviation). (A) Murine wildtype neutrophils. (B) Wildtype neutrophils with CXCR2 blocker SB225002. (C) TRPC6−/− neutrophils. (D) TRPC6−/− neutrophils with CXCR2 blocker SB225002. |

Fig 4. Model probabilities for murine neutrophils. The model probabilities for the analyzed models A—C are color coded and shown with respect to (A) x- and (B) y-direction (probabilities of model D are too small to be visualized). Wildtype neutrophils follow pure fractional Brownian motion parallel to the chemotactic gradient, whereas the dynamics of neutrophils under all other conditions is either exponentially or power-law tempered. |

Fig 5. Tempering behavior of murine neutrophils. (A) and (B) show the temporal behavior of the logarithmic derivative β(t) of the mean squared displacement perpendicular (A) and parallel (B) to the direction of chemotaxis. The time-scale τ* of tempering is compared in (C) and (D) for the four different cell groups (τ* = ∞ for model A, pure fBm). (E) and (F) show the exponent μ of power-law tempering of model C. The color intensities of the parameter bars are proportional to the corresponding model probabilities given in Fig 4. |
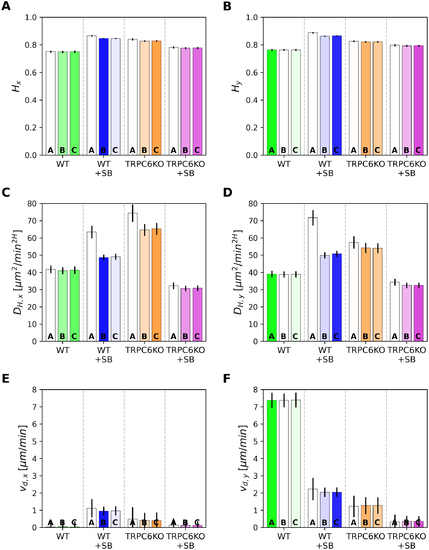
Fig 6. Comparison of model parameters for murine neutrophils. Parameters are plotted in x- and y-direction together with their standard deviation for the three analyzed models: A—fractional Brownian motion (fBm), B—fBm with exponential tempering, and C—fBm with power-law tempering. The color intensities of the parameter bars are proportional to the corresponding model probabilities in Fig 4. (A) and (B) Hurst exponent H, (C) and (D) generalized diffusion coefficient, (E) and (F) absolute value of drift velocity vd. |

Fig 7. Model parameters for the dynamics of neutrophils in zebrafish larvae. (A) and (C) give an overview of all different trajectories of neutrophils moving in zebrafish larvae. Paths of neutrophils have different lengths. Neutrophils treated with blocker SB225002 (marked as WT+SB) have a reduced drift (C) compared to untreated cells (A). Model probabilities for WT neutrophils (B) and for the WT+SB group favor the exponentially tempered model under all directions and conditions (color coding as in Fig 4). (E) and (F) show the temporal behavior of the logarithmic derivative β(t) of the mean squared displacement for the two cell groups. WT+SB neutrophils are tempered much more strongly than WT neutrophils. The movement of WT neutrophils in parallel to the direction of chemotaxis (y-direction) is only weakly tempered. (G)—(J) show the values of model parameter for fBm with exponential tempering: (G) Hurst exponent, (H) diffusion coefficient DH, (I) absolute value of drift vd, and (J) tempering time τ*. |

Fig 8. Comparison of arriving probabilities by simulations. (A) Probability distributions of first passage times for simulated cells at a distance of 200 μm. Model parameters calculated for the respective experimental conditions were used for simulations as given in Figs 5 and 6. There is a surge of WT neutrophils reaching their target after 20 min, whereas all other cell types show a delayed arrival. (B) Percentage of cells arriving at the target that is located at a distance a from the starting points of the cell ensemble. All simulated wildtype cells arrive at the target within 5 h, whereas CXCR2 inhibition and/or TRPC6 ablation markedly reduce the number of cells arriving at their target. |