FIGURE SUMMARY
Title

Bioluminescent Zebrafish Transplantation Model for Drug Discovery

Authors
Hason, M., Jovicic, J., Vonkova, I., Bojic, M., Simon-Vermot, T., White, R.M., Bartunek, P.
Source
Full text @ Front Pharmacol

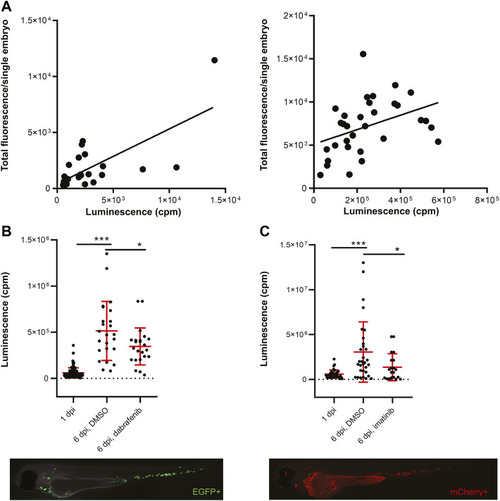
Transplanted cancer cells survive
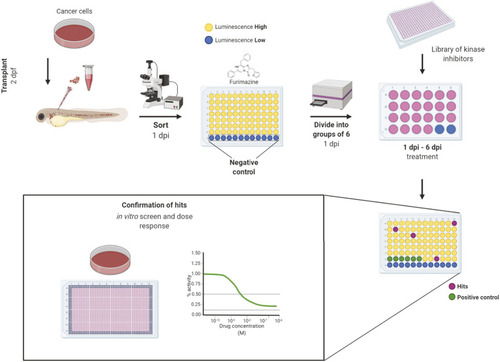
 in vivo in zebrafish embryos and their growth can be inhibited by small molecules. (A) Correlation of fluorescence to luminescence as measured in transplanted zebrafish embryos at 1 day post-injection (dpi). Every dot is a readout from a single embryo. On the left, the correlation of EGFP to NanoLuc in ZMEL1 is shown [slope is significantly non-zero, p = 0.0001, Goodness of fit (R) = 0.4916]. On the right, the correlation of mCherry to NanoLuc in K562 is shown [slope significantly non-zero, p = 0.0251, Goodness of fit (R) = 0.1563]. (B) Growth and drug inhibition of growth of ZMEL1 cells in zebrafish embryos, 1–6 dpi. ZMEL1 cells grew significantly in vivo from 1 to 6 dpi. The growth was significantly inhibited by a BRAF inhibitor, dabrafenib. Below, there is a representative image of a 1 dpi casper, prkdc−/− zebrafish embryo transplanted with green ZMEL1-EGFP-NLuc cells, imaged in the green GFP channel. (C) Growth and drug inhibition of growth of K562 cells in zebrafish embryos, 1–6 dpi. K562 cells grew significantly in vivo from 1 to 6 dpi. The growth was significantly inhibited by imatinib. Below, there is a representative image of a 1 dpi casper, prkdc−/− zebrafish embryo transplanted with red K562-mCherry-NLuc cells, imaged in the red mCherry channel. (B,C) Statistical significance was determined by unpaired two-tailed t-test. *p < 0.05 ***p < 0.001. Luminescence measured in vivo in single embryos is represented by a single dot in dot plots. Fluorescence images were acquired on Zeiss AxioZoom.V16 with Axiocam-506 mono camera and the ZEN Blue software.

Workflow of in vivo small-molecule using bioluminescence screening platform. The workflow of in vivo small-molecule screening started with cancer cell transplantation into 2 days post-fertilization (dpf) zebrafish embryos. The transplanted embryos were washed and kept in incubator overnight. At day 1 post-injection (dpi) the embryos were sorted according to fluorescence under an Olympus macroscope and were divided into wells of a 96-well solid white plate. Uninjected embryos in E3 water and E3 water without embryos were used as negative controls to determine the background level of luminescence. Luciferase assay was carried out using the Furimazine substrate by adding it into all wells equally and the luminescence was measured after 10 min of incubation on the EnVision plate reader. After the measurement, embryos were recovered, washed and randomly divided into groups of 6 animals into 24-well polystyrene plates, where they were treated by inhibitors from a library of kinase inhibitors at the final concentration of 10 µM and DMSO was used as negative control. We used dabrafenib and imatinib as positive controls. At the end of the experiment, at 6 dpi, the luminescence of whole embryos was measured again to determine the cell growth or its inhibition. The lower the final luminescence, compared to positive controls treated with DMSO, the stronger is the inhibitory effect. Finally, the compounds can be analyzed in vitro to determine dose response curves and to compare the in vitro vs. in vivo effectivity. Figure created in bioRENDER.

Kinase inhibitors active in transplanted ZMEL1 melanoma cells. (A) Inhibitors that targeted the RAS and p38 MAPK pathways and significantly inhibited melanoma cell growth in vivo. (B) Inhibitors that targeted cell cycle related proteins and significantly inhibited melanoma cell growth in vivo. (C) Inhibitors that targeted receptor tyrosine kinases (RTKs) and significantly inhibited melanoma cell growth in vivo. (A–C) Statistical significance was determined by Mann-Whitney test. *p < 0.04, **p < 0.002, ***p < 0.001. Luminescence measured in vivo in single embryos is represented by a single dot in dot plots. All experiments were done in 2–3 repeats. (D) List of all the inhibitors from A-C with their predicted main protein targets in zebrafish ZMEL1 cells. The last column with red bars on the right represents the average expression of individual target genes in zebrafish cells which was extracted from a publicly available RNA-sequencing dataset. Inhibitors with a potent new function in melanoma are labeled with a red asterisk.

Kinase inhibitor active in transplanted leukemia K562 cells. (A) Inhibitors that targeted the RAS and p38 MAPK pathways and significantly inhibited leukemia cell growth in vivo. (B) Inhibitors that targeted cell cycle and cell migration related proteins and significantly inhibited leukemia cell growth in vivo. (A,B) Statistical significance was determined by Mann-Whitney test. *p < 0.04, **p < 0.002, ***p < 0.001. Luminescence measured in vivo in single embryos is represented by a single dot in dot plots. All experiments were done in 2–3 repeats. (C) List of all the inhibitors from A-B with their predicted main protein targets in human K562 cells. The last column with red bars on the right represents the average expression of individual target genes in human cells which was extracted from a publicly available RNA-sequencing dataset. Inhibitors with a potent new function in leukemia are labeled with a red asterisk.

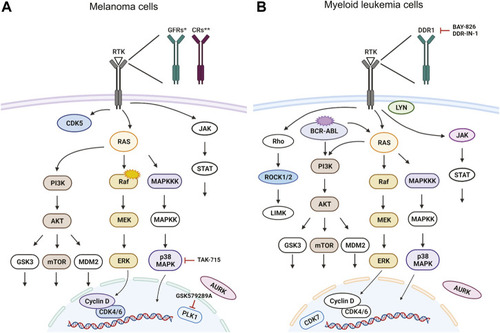
Targeted signaling pathways as predicted from in vivo kinase inhibitor screen. For simplicity, we show the predicted human proteins in this figure without the zebrafish paralogs. Proteins, that were targeted by our kinase inhibitor set are depicted in color, non-targeted ones are white. Selected inhibitors with a potent new function are depicted in the schemes as well. Signaling pathways in (A) BRAFV600E mutant melanoma cells and in (B) cells of chronic myelogenous leukemia (CML) with BCR-ABL translocation. Figure created in bioRENDER.

Acknowledgments
This image is the copyrighted work of the attributed author or publisher, and ZFIN has permission only to display this image to its users. Additional permissions should be obtained from the applicable author or publisher of the image. Full text @ Front Pharmacol