FIGURE SUMMARY
Title

Social isolation modulates appetite and avoidance behavior via a common oxytocinergic circuit in larval zebrafish

Authors
Wee, C.L., Song, E., Nikitchenko, M., Herrera, K.J., Wong, S., Engert, F., Kunes, S.
Source
Full text @ Nat. Commun.

Phospho-ERK-based mapping reveals OXT neuron modulation by social context.

a Left: MAP-mapping22 of 2-hr isolated fish vs fish in groups. Green voxels indicate significantly higher activity. Map combines data from 5 experiments in which isolated fish are compared with groups of 3 (2 experiments), 5 (1 experiment), or 10 (2 experiments). Yellow = outline of preoptic (PO) and posterior (PT) OXT populations used to quantify activity in Right. Tel = telencephalon, cH caudal hypothalamus, LC locus coeruleus, AP area postrema, HB hindbrain. A anterior, L left, V ventral. Scale bar = 100 µm. Right: Social isolation significantly activates PO and PT regions. Data for other stimuli were also included in Wee et al. (2019)6. Adjusted p-values for social isolation: ***p = 0.00084 (PO), *p = 0.03 (PT), p = 0.42 (whole brain), two-sided Wilcoxon signed-rank test relative to a median of 1, Bonferroni correction. b Maximum-intensity projection images showing pERK expression (magenta) in Tg(oxt:GFP)-positive (green) and surrounding neurons, from a representative dissected brain of an isolated fish (bottom) and a fish kept in groups of 3 (top). White arrows indicate examples of OXT neurons with high pERK intensities. Scale bar = 20 µm. This experiment was repeated more than 5 times with similar results. c Fish were either kept in groups of 3 (gray, n = 835 OXTPO/158 OXTPT neurons from 12 fish), isolated (pink, n = 803 OXTPO/128 OXTPT neurons from 11 fish), isolated but exposed to visual cues of conspecifics (red, n = 796 OXTPO/106 OXTPT neurons from 12 fish), or isolated but exposed to non-kin-conditioned water (blue, n = 751 OXTPO/115 OXTPT neurons from 11 fish) or kin-conditioned water (orange, n = 722 OXTPO/134 OXTPT neurons from 11 fish). Boxplot shows the median (center), interquartile range (IQR; box), 1.5 IQRs of the lower and upper quartile (whiskers), and outliers beyond this range (diamonds); Half-violin plot shows kernel-density estimate of normalized pERK values. OXTPO neurons: adjusted p = 0*** (group vs isolated)/0*** (group vs visual)/1.7×104*** (group vs non-kin water)/1 (group vs kin water)/0.023* (isolated vs visual)/3.4×10−18*** (isolated vs non-kin water)/0*** (isolated vs kin water)/4.8×10−8*** (visual vs non-kin water)/4.2×10−22***(visual vs kin water)/0.0014** (kin vs non-kin water). Kruskal–Wallis Test with Tukey–Kramer correction for multiple comparisons. OXTPT neurons: adjusted p = 7.9×10⁻⁶*** (group vs isolated)/0.0071** (group vs visual)/4.3×10−6*** (group vs non-kin water)/0.20 (group vs kin water)/1.1×10−13*** (isolated vs visual)/6.8×10−21*** (isolated vs non-kin water)/1.0×10−10*** (isolated vs kin water)/0.58 (visual vs non-kin water)/0.69 (visual vs kin water)/0.032* (kin vs non-kin water). Kruskal–Wallis test with Tukey–Kramer correction for multiple comparisons. d Spatial distribution of OXT neurons from each category, color coded according to normalized pERK intensity (most active = yellow, least active = deep blue, colorbar shows normalized pERK value). See Methods. e Anterior–posterior (AP) localization of “active cells” sampled from each category. See Methods. Source data are provided as a Source Data file.

Calcium imaging confirms OXT neuron modulation by conspecific cues.

a Left: Maximum z-projection of oxytocin neurons. The Tg(oxt:Gal4; UAS:GCaMP6s) transgenic line labels OXTPO neurons strongly, with weaker labeling of the more ventro-posteriorly located OXTPT cluster. Scale bar = 20 µm. Right: Mean OXT neuron fluorescence over a 60-s period post stimulus from two different fish, one imaged with kin and non-kin water (top), and another with kin and adult water (bottom). This experiment was repeated on 8 and 10 fish, respectively, with similar results. b Left: Mean stimulus-triggered calcium activity (Δf/f) of OXTPO (top) and OXTPT (bottom) neurons. All fish (29 fish, n = 1033 neurons) were imaged with water or kin water, some also with either non-kin (8 fish, n = 245 neurons) or adult water (10 fish, n = 374 neurons). Of all neurons imaged, only 10 were from the OXTPT population. Right: Mean stimulus-triggered Δf/f of each neuron normalized to its own mean water-flow response. Gray broken line indicates stimulus onset. Shading indicates SEM. Asterisks show statistical comparison of mean Δf/f over a 60-s post-stimulus period for different cues, two-sided Kruskal–Wallis Test with Tukey–Kramer correction. OXTPO: ***p = 1.4 × 10−9 (water vs kin)/p = 0.13 (water vs non-kin)/***p = 4.0×10⁻¹¹ (water vs adult)/p = 0.30 (kin vs non-kin)/***p = 0 (kin vs adult)/***p = 2.5 × 10−11 (non-kin vs adult). OXTPT: p = 0.99 (water vs kin)/p = 0.76 (water vs non-kin)/p = 0.97 (water vs adult)/p = 0.85 (kin vs non-kin)/p = 1 (kin vs adult)/p = 0.95 (non-kin vs adult). c Spatial distribution and percentages of neurons that show either suppressed (top) or enhanced (bottom) responses to each cue relative to water. See Methods and Supplementary Fig. 2c for details. d Mean stimulus-triggered Δf/f of neurons classified as being suppressed (top) or enhanced (bottom) by each cue, normalized to their mean water-flow response. Shading indicates SEM. Asterisks show statistical comparison of mean Δf/f over a 60-s post-stimulus period for different cues, two-sided Kruskal–Wallis test with Tukey–Kramer correction. For water responses, only neurons that had suppressed or enhanced activity induced by any of the other cues were included in the statistical analysis. Suppressed activity: ***p = 0 (water vs kin)/***p = 1.3 × 10−7 (water vs non-kin)/***p = 8.2 × 10−7 (water vs adult)/p = 1 (kin vs non-kin)/p = 0.71 (kin vs adult)/p = 0.84 (non-kin vs adult); n = 429 (water)/390 (kin)/47 (non-kin)/65 (adult). Enhanced activity: ***p = 6.7 × 10−14 (water vs kin)/***p = 2.8 × 10−10 (water vs non-kin)/***p = 0 (water vs adult)/p = 0.88 (kin vs non-kin)/***p = 8.5 × 10−7 (kin vs adult)/**p = 0.0043 (non-kin vs adult); n = 265 (water)/117 (kin)/55 (non-kin)/116 (adult). e Left: overlap between kin and non-kin water responses. Right: overlap between kin and adult water responses. Red = enhancement, Blue = suppression, White = no change. Kin cues induced the highest percentage of suppression (25–30%) and lowest percentage of activation (9–11%), whereas adult cues induced the lowest percentage of OXT neuron suppression (14%) and highest percentage of activation (46%) of OXT neurons. Non-kin cues induced an intermediate level of OXT neuron suppression (18%) and activation (23%). See Supplementary Fig. 2d, e for additional visualization. Source data are provided as a Source Data file.

Calcium imaging reveals olfactory bulb encoding of conspecific stimuli.

a Left: Schematic of imaging and cue-delivery setup. Two-photon (2-P) calcium imaging of the olfactory bulb was performed as each Tg(HuC:GCaMP6s) fish was presented with pulses of kin water, non-kin water, and adult water (randomized order), alternated with pulses of water. Right: Stimulus-triggered average of all olfactory bulb (OB) neuron responses (Δf/f) to kin, non-kin, and adult water. b Δf/f traces (bottom, raster plot for an example fish) from individual units (see Methods) within the OB were correlated with regressors (top) fit to each stimulus type. c Mean OB Δf/f integrated over a 60-s period post stimulus from a single fish (same fish shown in Fig. 3b, also see Supplementary Fig. 3), shown for each plane (ventral to dorsal) and each cue in a volumetric stack. Bottom-most panel shows the anatomy references for each plane. A anterior, L left. Scale bar = 50 µm. This experiment was repeated on 10 fish with similar results. d Δf/f traces from individual units were extracted from the OB (see Methods). Top: Correlation coefficients for each unit (n = 477 units from the same fish in b and c) with each regressor are color coded (blue to red) and overlaid over the anatomy image per z-plane. Bottom: Each unit’s response (i.e., correlation coefficient) to water and conspecific stimuli, from the same fish as above, clustered using K-means clustering (as in e). e K-means clustering (k = 12) was performed on the matrix of correlation coefficients (color coded blue to red) to water and conspecific stimuli (n = 4018 units from 10 fish). Number of units within each cluster and percentage representation of total units are displayed on the right. Clusters specific to kin water and adult water, as well as clusters with mixed selectivity were observed. f Mean stimulus-triggered Δf/f for each cluster, aligned to stimulus onset. Order of clusters is the same as in (e). As OB responses are often sustained across the entire stimulus epoch, negative Δf/f and correlation coefficients in response to water flow are likely due to washout of residual olfactants, rather than an active suppression of the signals by water flow. g 3D plot displaying the spatial localization of units within each cluster, for a few selected clusters (all clusters shown in Supplementary Fig. 3c). XY coordinates for all units per fish were scaled linearly to their minimum and maximum values in each dimension. Adult-responsive clusters tend to be situated laterally (e.g., cluster 7), whereas clusters that show more general conspecific responses (e.g., clusters 4,5,10) are situated more medially. Kin-specific responses (clusters 1 and 2) are more scattered, though they extend more laterally than general conspecific-responsive clusters. A anterior, P posterior, D dorsal, V ventral. Source data are provided as a Source Data file.

A genetically defined GABAergic subpallial population discriminates social cues.

a Schematic depicting the hypothesized telencephalic subpallial (SPa) pathway linking olfactory bulb conspecific cue responses to preoptic OXT neurons. b Top left: Maximum-projection image showing overlap of Tg(y321:Gal4;UAS:Kaede) (green) with GABAergic neurons labeled by Tg(Gad1b:RFP) (magenta) in the telencephalon. y321 and Gad1b co-expression occurs in both the anterior subpallium (aSPa, rostral to the anterior commissure) and posterior commissure (pSPa, caudal to the anterior commissure and rostral to the preoptic area). Top right: Lower-magnification maximum-projection image showing overlap of Tg(y321:Gal4;UAS:Kaede) with Tg(Gad1b:RFP) (magenta). Overall, 88.2 ± 1.5% of aSPay321 and 87.3 ± 3.06% of pSPay321 neurons are GABAergic (n = 7 fish). OB olfactory bulb, Tel telencephalon, PO preoptic area; PT posterior tuberculum. Bottom: y321 and Gad1b overlap shown across different z-planes. All scale bars = 20 µm. This experiment was repeated on 7 fish with similar results. c OXT neuron dendrites project into the location where SPay321 neurons reside. Top: Maximum-projection image; Bottom: 3D projection at different rotation angles. Scale bar = 50 µm. This experiment was repeated on more than 3 fish with similar results. d 2-P calcium imaging was performed on Tg(y321:Gal4; UASGCaMP6s) neurons in the aSPa region on fish exposed to kin, non-kin, and adult water cues. See Supplementary Figs. 4, 5 for imaging and analysis of the same telencephalic regions in Tg(HuC:GCaMP6s; Gad1b:RFP fish). Top left: Maximum-projection image showing the aSPay321 region imaged. Scale bar = 50 µm. Top right: Example Δf/f trace of a kin-responsive unit. Bottom: Stimulus-triggered averages for units that are kin-selective, adult-selective, or responsive to multiple conspecific cues. Shaded region indicates SEM. This experiment was repeated on 4 fish with similar results. e K-means clustering (k = 12) was performed on the matrix of correlation coefficients (color coded blue to red) to water and conspecific stimuli n = 4875 units from 4 fish. Number of units within each cluster and percentage representation of total units are displayed on the right. Clusters specific to kin, non-kin, and adult water, as well as clusters with mixed selectivity were observed. f Mean stimulus-triggered Δf/f for each cluster, aligned to stimulus onset. Order of clusters is the same as in (e). Source data are provided as a Source Data file.

Optogenetic stimulation of subpallial neurons suppresses OXT activity.

a Maximum-projection image showing regions of optogenetic stimulation (aSPay321 neurons) and calcium imaging (OXT neurons in PO or PT, or neuropil bundles in PT outlined in yellow). This experiment was repeated on 18 fish with similar results. b Mean Δf/f traces from either aSPay321 neurons or OXT cell bodies/neuropil bundles after stimulation with a 633 nm laser focused on the aSPa region at 60-s intervals. Black traces depict mean Δf/f of an example ReaChR-negative-control fish (top) or y321-negative-control fish (bottom). Red traces depict mean Δf/f from an example Tg(y321:Gal4, oxt:Gal4; UAS:GCaMP6s; UAS:ReaChR-RFP) fish of its aSPay321 neurons (top), OXTPO/PT cell bodies (middle), or neuropil (bottom), subject to aSPay321 optogenetic stimulation. Orange lines indicate stimulus onset. Each box represents calcium traces from an individual representative fish. Shaded region indicates SEM. Blue arrows indicate dips in OXT neuropil activity in the presence or absence of optogenetic y321 activation. c Stimulus-triggered averages showing the mean Δf/f before and after the light stimulus. Responses to each stimulus were first averaged per unit (cell body or neuropil bundle) before being averaged across all units to obtain the Δf/f trace. Shaded region indicates SEM. Two-sided Wilcoxon rank-sum test was used for all statistical comparisons. Top panel: The calcium response (Δf/f) of aSPay321 neurons to 633 nm laser stimulation is significantly higher in the presence (red, n = 320 neurons from 15 fish) than absence (black, n = 118 neurons from 4 fish) of ReaChR (*p = 0.031). Middle panel: The calcium response of OXTPO/PT neurons under aSPay321 optogenetic stimulation is significantly lower (***p = 5.4 × 10−6, n = 410 neurons from 18 fish) than for negative controls (Tg(oxt:Gal4; UAS:GCaMP6s; UAS:ReaChR-RFP) fish) exposed to the same light stimulus (n = 103 neurons from 5 fish). When we separated these OXT neurons according to their anterior–posterior position, we found that OXTPO neurons showed significant suppression after aSPay321 optogenetic stimulation compared with negative controls (***p = 0.00028, n = 294/91 neurons), but no significant difference was observed for OXTPT neurons (OXTPT; p = 0.198, n = 116/12 neurons). Bottom panel: OXT neuropil calcium responses under y321 optogenetic stimulation are overall significantly lower than for negative controls exposed to the same light stimulus (***p = 2.7 × 10−5, n = 36/10 neuropil regions). The dip in neuropil activity under y321 stimulation is significantly less negative than the negative controls in the first 10-s epoch (**p = 0.0094), whereas neuropil activity is significantly lower than the negative controls in the next 30-s epoch (***p = 2.4 × 10−5). Gray bars indicate the 40-s period across which Δf/f was integrated for statistical analysis; asterisk color reflects the group with the more negative (i.e., lower) integrated value. Source data are provided as a Source Data file.

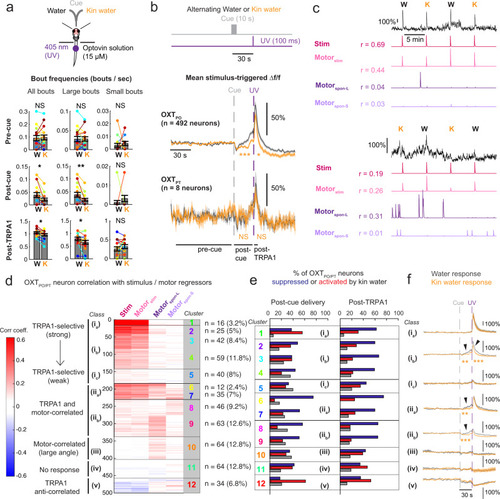
Chemical kin cues modulate OXT neuron nociceptive responses and behavior.

a Top: Schematic showing setup used to probe the effect of conspecific-conditioned water on TRPA1-induced nocifensive behavior. Bottom: Kin water significantly reduced the frequency of large-angle (>50°) but not small- (≤50°) angle tail bends, both after cue delivery and post TRPA1 stimulation, though the overall bout frequency was much higher after TRPA1 stimulation (bottom-most row). Post-cue delivery: p = 0.011* (all bouts)/0.0039** (large angle)/0.93 (small angle). Post TRPA1: p = 0.045* (all bouts)/0.019* (large angle)/0.86 (small angle). There was no significant change in bout kinematics during epochs outside of kin cue or TRPA1 delivery (p = 0.65/0.55/0.71 for total, large, and small tail bends, respectively). One-sided Wilcoxon signed-rank test, n = 16 fish. More kinematic features are shown in Supplementary Fig. 8a. Data are presented as mean values ±SEM. b Top: Alternating pulses of water or conspecific water were presented, followed by a 100-ms pulse of UV light after 30 s to activate TRPA1 receptors. Half of the fish had kin water as the first stimulus. Bottom: Stimulus-triggered averages for OXTPO (n = 492) or OXTPT (n = 8) neuron calcium activity (Δf/f) in response to a water pulse or kin water delivery. The integrated Δf/f of OXTPO neurons both post cue delivery (***p = 2.6 × 10−12) and post TRPA1 stimulus (*p = 0.026) was significantly lower after kin water as compared with water flow. There was no significant effect of kin water on OXTPT neuron activity both post cue delivery (p = 1) and post TRPA1 stimulus (p = 1), two-sided Wilcoxon signed-rank test. Black horizontal line shows the region over which the pre- and post TRPA1 calcium activity and behavior were averaged to calculate precue, post-cue, and post TRPA1 responses. Gray dashed line = water or kin water delivery, purple dashed line = UV stimulus onset, Shading indicates SEM. c Calcium traces (Δf/f) and the respective stimulus and motor regressors (see Results and Methods), as well as their correlation coefficients with each regressor are shown for two example OXTPO neurons. d K-means clustering (k = 12) was performed on the matrix of correlation coefficients to each of the stimulus or motor regressors (n = 500 units from 16 fish). Number of units within each cluster and percentage representation of total units are displayed on the right. Clusters specific to TRPA1 stimulation, as well as motor-correlated clusters were observed. We grouped these clusters into broader classes and subclasses (i–v), which are indicated by the black lines and boxes. See also Supplementary Fig. 8c, d. e The percentage of OXTPO/PT neurons within each cluster that were suppressed, activated, or did not show any change when exposed to kin water, either following cue delivery (left) or TRPA1 stimulation (right). Red = enhancement, Blue = suppression, White = no change. The broader classes (i–v) are indicated by black boxes. See also Supplementary Fig. 8d. f Mean stimulus-triggered calcium responses (Δf/f) of all OXTPO/PT neurons in the presence of water (black) or kin water (orange), as a function of their class/subclass. Note scale bar for class ia is different from the others due to the intensity of TRPA1 responses. For class ib, the integrated calcium response both post cue delivery (**p = 0.003) and post TRPA1 stimulus (***p = 2.0 × 10−5) was significantly lower in the presence of kin water as compared with water flow. For class iia–b, the integrated calcium response post cue delivery (**p = 0.0013 or ***p = 7.6 × 10−7) was significantly lower with kin water as compared with water flow, but the response to TRPA1 stimulus was not significantly lower (p = 1 or p = 0.06, respectively), two-sided Wilcoxon signed-rank test, n = 16/126/40/47/109/64/64/34 neurons (ia, ib, ic, iia, iib, iii, iv, and v, respectively). Source data are provided as a Source Data file.

Manipulation of OXT signaling affects appetite in a social-context- dependent manner.

a Schematic depiction of social feeding behavior experiments. Example images are shown (inset shows higher (100x) magnification). b Left: Gut fluorescence in a single experiment demonstrates that isolated fish, on average, ingest less paramecia than fish maintained in a group of 3 conspecifics. All gut fluorescence measurements are normalized to the group mean (**p = 0.0058, n = 21/17 fish, two-sided Wilcoxon rank-sum test). Right: Normalized food intake (gut fluorescence normalized to the average for groups of 3 fish) scales with group size (1 fish, n = 36; 2 fish, n = 7; 3 fish, n = 52; 5 fish, n = 29 over 4 experiments). **p = 0.0065 (1 fish vs 3 fish)/**p = 0.0035 (1 fish vs 5 fish), two-sided Kruskal–Wallis test with correction for multiple comparisons. Data are presented as mean values ±SEM. c Water-borne but not visual cues rescue reduced feeding of isolated fish. Left: Results within a single experiment. *p = 0.03 (isolated vs group), *p = 0.04 (isolated vs kin water), p = 0.17 (isolated vs visual), n = 24/24/22/23 fish, two-sided Wilcoxon rank-sum test. Right: Average of 6 experiments, p = ***2.8283 × 10−4 (single vs group), *p = 0.02 (single vs kin water), p = 0.35 (single vs visual), n = 86/86/55/87 fish, two-sided Wilcoxon rank-sum test. Data are presented as mean values ±SEM. d Cell-specific chemogenetic ablation of OXT neurons specifically rescues the effect of social isolation on appetite. OXT neurons were ablated via OXT neuron-specific expression of bacterial nitroreductase using Tg(oxt:Gal4;UAS:nfsb-mCherry) fish6, 44. Animals were incubated with a group of conspecifics and the prodrug metronidazole (MTZ) during the period from 5 to 7 dpf. This treatment resulted in loss of ~80% of nitroreductase-labeled preoptic OXT cells (unablated = 20.3 ± 1.1 neurons, ablated = 4.5 ± 0.5 neurons; n = 20 control fish, 29 fish with ablation). *p = 0.015 (isolated control vs group control), **p = 0.0017 (isolated control vs single ablated), p = 0.76 (isolated ablated vs group ablated), n = 65/59/57/56 fish over 5 experiments, two-sided Wilcoxon rank-sum test. Controls are metronidazole (MTZ)-treated, non-transgene-expressing siblings. Data are presented as mean values ±SEM. e The oxytocin receptor antagonist (L-368,899) restores social feeding levels to isolated animals. Antagonist (5uM) was added to the incubation water at the start of the 2-hr isolation period (see (a)). Data are presented as mean values ±SEM. **p = 0.0022 (single vs group), **p = 0.0091 (single control vs single antagonist), p = 0.09 (single antagonist vs group antagonist), n = 40/50/29/34 fish over 3 experiments, two-sided Wilcoxon rank-sum test. Data are presented as mean values ±SEM. f An oxytocin receptor agonist (WAY 267,484) (5 µM) reduces group food ingestion to the level of isolated animals. Agonist was added to the incubation water at the start of the 2-hr isolation period (see (a)). **p = 0.0022 (single vs group), p = 1 (single control vs single agonist), **p = 0.0069 (group control vs group agonist), n = 40/50/20/21 fish over 3 experiments, two-sided Wilcoxon rank-sum test. Control groups for both (e) and (f) are the same sets of fish, split up for better visualization. Data are presented as mean values ±SEM. g Comparison of food intake of oxt null mutants (oxt−/−) and their heterozygous wild-type siblings (oxt+/−) in isolated and nonisolated contexts Single-group differences in food consumption are abolished—however, food intake was reduced in groups, rather than enhanced in isolated fish. **p = 0.0011 (single vs group), p = 0.65 (single control vs single mutant), **p = 0.0012 (group control vs group mutant), n = 60/59/58/54 fish over 5 experiments, two-sided Wilcoxon rank-sum test. Data are presented as mean values ±SEM. h Model for how oxytocin neurons integrate information on social state to control appetite and nocifensive behaviors. We posit that social chemical cues are olfactory, and that GABAergic neurons in the subpallium transform olfactory bulb activation into inhibitory signals that differentially modulate the OXT population. The OXT circuit modulates nocifensive behavior via brainstem premotor neurons6. The OXT neurons project extensively to other areas of the hypothalamus and the pituitary; these downstream regions may be involved in mediating effects on appetite43. Source data are provided as a Source Data file.

Acknowledgments
This image is the copyrighted work of the attributed author or publisher, and ZFIN has permission only to display this image to its users. Additional permissions should be obtained from the applicable author or publisher of the image. Full text @ Nat. Commun.