IMAGE

Fig. 2

ID
ZDB-IMAGE-220517-29
Source
Figures for Wee et al., 2022
Image
Figure Caption

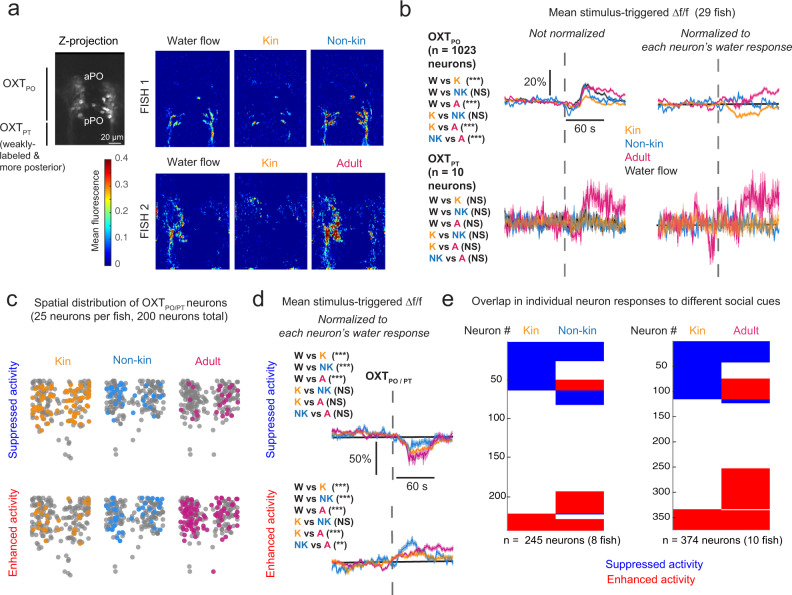
Fig. 2 Calcium imaging confirms OXT neuron modulation by conspecific cues.

a Left: Maximum z-projection of oxytocin neurons. The Tg(oxt:Gal4; UAS:GCaMP6s) transgenic line labels OXTPO neurons strongly, with weaker labeling of the more ventro-posteriorly located OXTPT cluster. Scale bar = 20 µm. Right: Mean OXT neuron fluorescence over a 60-s period post stimulus from two different fish, one imaged with kin and non-kin water (top), and another with kin and adult water (bottom). This experiment was repeated on 8 and 10 fish, respectively, with similar results. b Left: Mean stimulus-triggered calcium activity (Δf/f) of OXTPO (top) and OXTPT (bottom) neurons. All fish (29 fish, n = 1033 neurons) were imaged with water or kin water, some also with either non-kin (8 fish, n = 245 neurons) or adult water (10 fish, n = 374 neurons). Of all neurons imaged, only 10 were from the OXTPT population. Right: Mean stimulus-triggered Δf/f of each neuron normalized to its own mean water-flow response. Gray broken line indicates stimulus onset. Shading indicates SEM. Asterisks show statistical comparison of mean Δf/f over a 60-s post-stimulus period for different cues, two-sided Kruskal–Wallis Test with Tukey–Kramer correction. OXTPO: ***p = 1.4 × 10−9 (water vs kin)/p = 0.13 (water vs non-kin)/***p = 4.0×10⁻¹¹ (water vs adult)/p = 0.30 (kin vs non-kin)/***p = 0 (kin vs adult)/***p = 2.5 × 10−11 (non-kin vs adult). OXTPT: p = 0.99 (water vs kin)/p = 0.76 (water vs non-kin)/p = 0.97 (water vs adult)/p = 0.85 (kin vs non-kin)/p = 1 (kin vs adult)/p = 0.95 (non-kin vs adult). c Spatial distribution and percentages of neurons that show either suppressed (top) or enhanced (bottom) responses to each cue relative to water. See Methods and Supplementary Fig. 2c for details. d Mean stimulus-triggered Δf/f of neurons classified as being suppressed (top) or enhanced (bottom) by each cue, normalized to their mean water-flow response. Shading indicates SEM. Asterisks show statistical comparison of mean Δf/f over a 60-s post-stimulus period for different cues, two-sided Kruskal–Wallis test with Tukey–Kramer correction. For water responses, only neurons that had suppressed or enhanced activity induced by any of the other cues were included in the statistical analysis. Suppressed activity: ***p = 0 (water vs kin)/***p = 1.3 × 10−7 (water vs non-kin)/***p = 8.2 × 10−7 (water vs adult)/p = 1 (kin vs non-kin)/p = 0.71 (kin vs adult)/p = 0.84 (non-kin vs adult); n = 429 (water)/390 (kin)/47 (non-kin)/65 (adult). Enhanced activity: ***p = 6.7 × 10−14 (water vs kin)/***p = 2.8 × 10−10 (water vs non-kin)/***p = 0 (water vs adult)/p = 0.88 (kin vs non-kin)/***p = 8.5 × 10−7 (kin vs adult)/**p = 0.0043 (non-kin vs adult); n = 265 (water)/117 (kin)/55 (non-kin)/116 (adult). e Left: overlap between kin and non-kin water responses. Right: overlap between kin and adult water responses. Red = enhancement, Blue = suppression, White = no change. Kin cues induced the highest percentage of suppression (25–30%) and lowest percentage of activation (9–11%), whereas adult cues induced the lowest percentage of OXT neuron suppression (14%) and highest percentage of activation (46%) of OXT neurons. Non-kin cues induced an intermediate level of OXT neuron suppression (18%) and activation (23%). See Supplementary Fig. 2d, e for additional visualization. Source data are provided as a Source Data file.

Acknowledgments
This image is the copyrighted work of the attributed author or publisher, and ZFIN has permission only to display this image to its users. Additional permissions should be obtained from the applicable author or publisher of the image. Full text @ Nat. Commun.