
- Title
-
OXSR1 inhibits inflammasome activation by limiting potassium efflux during mycobacterial infection
- Authors
- Hortle, E., Tran, V.L., Wright, K., Fontaine, A.R., Pinello, N., O'Rourke, M.B., Wong, J.J., Hansbro, P.M., Britton, W.J., Oehlers, S.H.
- Source
- Full text @ Life Sci Alliance
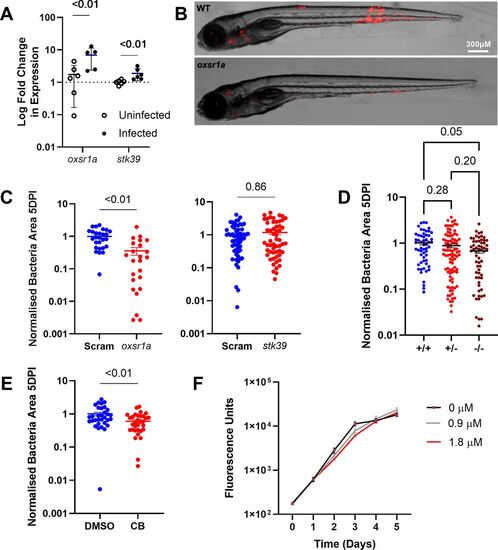
Figure 1. Infection-induced OXSR1 aids the growth of M. marinum in zebrafish.
(A) Relative expression of oxsr1a and stk39 in zebrafish embryos at 3 dpi with WT M. marinum, compared with age-matched uninfected controls. Biological replicates (n = 6) each represent pooled RNA from 7 to 10 embryos. (B) Representative images of M. marinum–tdTomato (red) bacterial burden in WT and mosaic F0 oxsr1a crispant embryos. (C) Quantification of M. marinum bacterial burden in WT and mosaic F0 oxsr1a crispant embryos and F0 stk39 crispant embryos. Each graph shows combined results of two independent experiments. (D) Quantification of M. marinum bacterial burden in WT, heterozygous and homozygous oxsr1a knockout embryos. Graph shows combined results of two independent experiments. (E) Quantification of WT M. marinum bacterial burden in DMSO vehicle control and Compound B-treated embryos at 1.8 μM. (F) Quantification of axenic M. marinum–tdTomato growth by fluorescence in 7H9 broth culture supplemented with Compound B. Red line (1.8 μM) indicates the concentration used to treat infected embryos. EXPRESSION / LABELING:
PHENOTYPE:
|
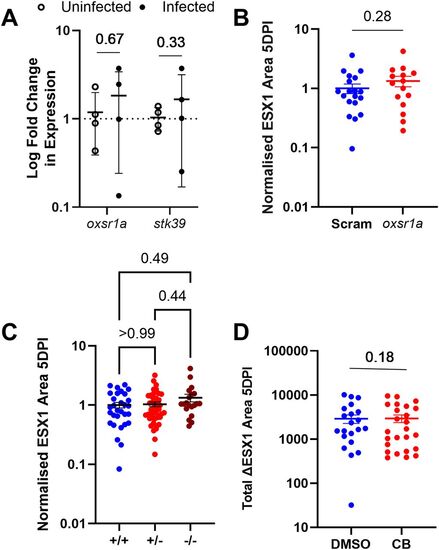
Figure 2. ∆ESX1-M. marinum does not induce OXSR1 gene expression.
(A) Relative expression of oxsr1a and stk39 in zebrafish embryos at 3 days post infection with ∆ESX1–M. marinum compared with age-matched uninfected controls. Biological replicates (n = 4) represent pooled RNA from 7 to 10 embryos. (B) Quantification of ∆ESX1–M. marinum bacterial burden in WT and mosaic F0 oxsr1a CRISPR embryos. (C) Quantification of ∆ESX1–M. marinum bacterial burden in WT, heterozygous and homozygous oxsr1a knockout embryos. (D) Quantification of ∆ESX1–M. marinum bacterial burden in DMSO vehicle control and Compound B–treated embryos at 1.8 μM. EXPRESSION / LABELING:
|
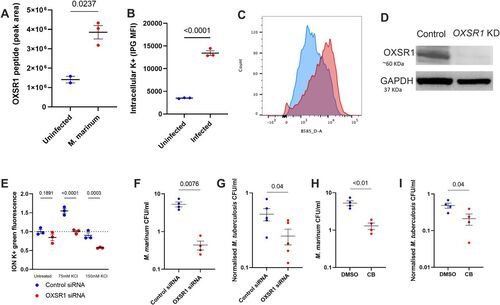
Figure 3. OXSR1 aids the growth of M. tuberculosis in human THP-1 cells.
(A) Quantification of OXSR1 protein in M. marinum–infected WT differentiated THP-1 cells, measured by mass spectrometry. (B) ION K+ green mean fluorescence intensity (measured by flow cytometry) of M. marinum–infected THP-1 cells. (B, C) Representative flow cytometry plots of (B). (D) Western blot of OXSR1 knockdown and vector control THP-1 cell lines, showing loss of OXSR1. Full un-edited blots are included in Source Data. (E) Fold change of ION K+ green mean fluorescence intensity (measured by flow cytometry) of undifferentiated control and OXSR1 knockdown THP-1 cells in media with increasing K+ content. (F) Quantification of intracellular M. marinum burden in WT and OXSR1 knockdown differentiated THP-1 cells at 1 dpi. (G) Quantification of intracellular M. tuberculosis burden in WT and OXSR1 knockdown differentiated THP-1 cells at 3 dpi. (H) Quantification of intracellular M. marinum burden in WT differentiated THP-1 cells treated with Compound B or vehicle control at 1 dpi. (I) Quantification of intracellular M. tuberculosis burden in WT differentiated THP-1 cells treated with Compound B or vehicle control at 3 dpi. Each dot represents the CFU from an infected well in a single representative experiment and the experiment was repeated three times. M. tuberculosis burden data are presented as CFU adjusted to 0 day post infection intracellular bacterial burden. Source data are available for this figure. |
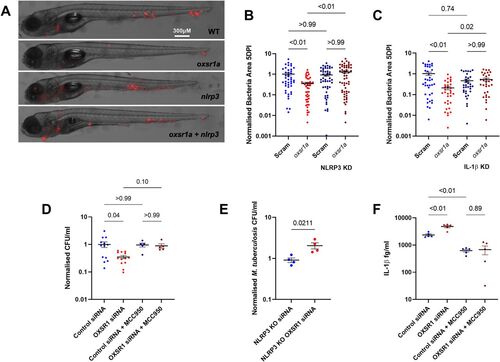
Figure 4. Infection-induced OXSR1 suppresses inflammasome activity to aid mycobacterial infection.
(A) Representative images of M. marinum–tdTomato (red) bacterial burden in 5 dpi WT, mosaic F0 oxsr1a, nlrp3, and dual oxsr1a nlrp3 crispant embryos. (B) Quantification of WT M. marinum bacterial burden in WT, mosaic F0 oxsr1a, nlrp3, and dual oxsr1a nlrp3 crispant embryos. Combined results of three biological replicates. (C) Quantification of WT M. marinum bacterial burden in WT, mosaic F0 oxsr1a, Il1b, and dual oxsr1a Il1b crispant embryos. Combined results of two biological replicates. (D) Quantification of intracellular M. tuberculosis bacterial burden in WT and OXSR1 knockdown differentiated THP-1 cells at 3 dpi. (E) Quantification of intracellular M. tuberculosis burden in WT and OXSR1 knockdown differentiated NLRP3 knockout THP-1 cells at 3 dpi. (F) IL-1β content in the supernatant of M. tuberculosis–infected WT and OXSR1 knockdown differentiated THP-1 cells at 3 dpi. For cell experiments (D, E, F): each dot represents the CFU from an infected well in a single representative experiment and the experiment was repeated three times. PHENOTYPE:
|
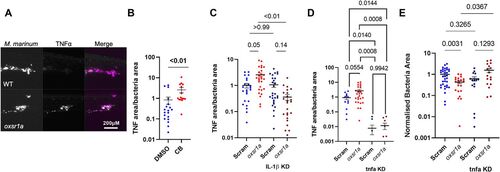
Figure 5. Infection-induced OXSR1 suppresses inflammasome activity to aid mycobacterial infection.
(A) Representative images of Tg(tnfa:GFP)pd1028 fluorescence around M. marinum granulomas. Scale bar represents 200 μM. (B) Quantification of TNF-α fluorescence per bacterial area in WT embryos treated with Compound B. (C) Quantification of TNF-α fluorescence per bacterial area in WT, mosaic F0 oxsr1a, Il1b, and dual oxsr1a Il1b crispant embryos. Combined results of two independent experiments. (D) Quantification of TNF-α fluorescence per bacterial area in WT, mosaic F0 oxsr1a, tnfa, and dual oxsr1a tnfa crispant embryos. Combined results of two independent experiments. (E) Quantification of bacterial burden in WT, mosaic F0 oxsr1a, tnfa, and dual oxsr1a tnfa crispant embryos. Combined results of two independent experiments. Fish were infected with WT M. marinum by caudal vein injection at 30 h post fertilization and analysed 5 dpi. |