
|
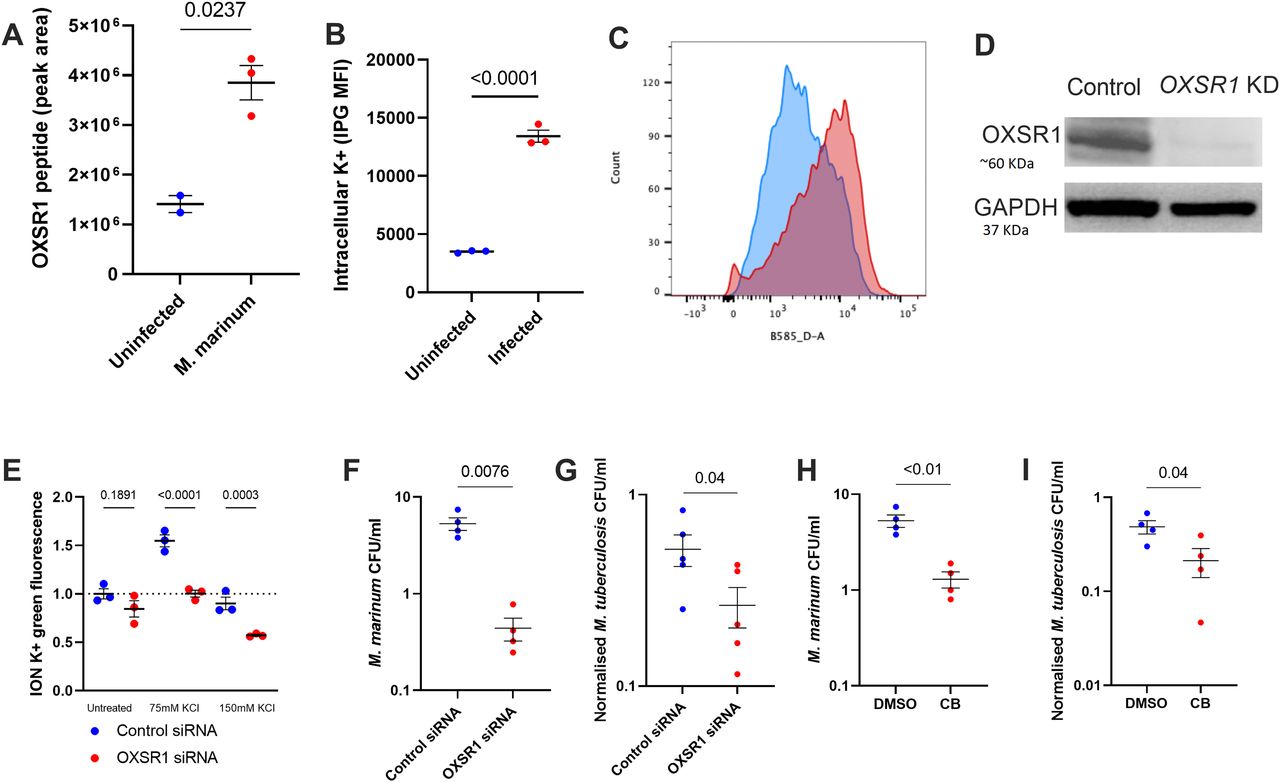
Fig. 3
(A) Quantification of OXSR1 protein in M. marinum–infected WT differentiated THP-1 cells, measured by mass spectrometry. (B) ION K+ green mean fluorescence intensity (measured by flow cytometry) of M. marinum–infected THP-1 cells. (B, C) Representative flow cytometry plots of (B). (D) Western blot of OXSR1 knockdown and vector control THP-1 cell lines, showing loss of OXSR1. Full un-edited blots are included in Source Data. (E) Fold change of ION K+ green mean fluorescence intensity (measured by flow cytometry) of undifferentiated control and OXSR1 knockdown THP-1 cells in media with increasing K+ content. (F) Quantification of intracellular M. marinum burden in WT and OXSR1 knockdown differentiated THP-1 cells at 1 dpi. (G) Quantification of intracellular M. tuberculosis burden in WT and OXSR1 knockdown differentiated THP-1 cells at 3 dpi. (H) Quantification of intracellular M. marinum burden in WT differentiated THP-1 cells treated with Compound B or vehicle control at 1 dpi. (I) Quantification of intracellular M. tuberculosis burden in WT differentiated THP-1 cells treated with Compound B or vehicle control at 3 dpi. Each dot represents the CFU from an infected well in a single representative experiment and the experiment was repeated three times. M. tuberculosis burden data are presented as CFU adjusted to 0 day post infection intracellular bacterial burden.
Source data are available for this figure.