
- Title
-
LED Zappelin': An open source LED controller for arbitrary spectrum visual stimulation and optogenetics during 2-photon imaging
- Authors
- Zimmermann, M.J.Y., Maia Chagas, A., Bartel, P., Pop, S., Prieto-Godino, L.L., Baden, T.
- Source
- Full text @ HardwareX

Stimulator design. a. A fully assembled stimulator. b. Rendering of the custom-printed circuit board which accommodates the microcontroller, the LED driver and up to 24 LED channels. c. Schematics illustrating the circuit that controls the LED output. The blanking input can be inverted by a switch before reaching the |
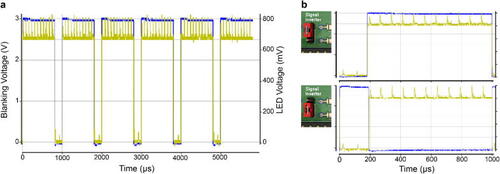
The blanking signal controls LED illumination. a. Oscilloscope reading of the blanking signal (blue) efficiently switching off an LED (yellow). The blanking is operated here without noticeable delay. b. as a., shown for a 1 ms scanning cycle, the two possible configurations for the blanking signal input, with a |

LED electrical power over duty cycle (PWM). a. Power recording of a 4 LED system using the TLC5947 (solid lines) and their expected brightness if directly controlled by a microcontroller (dashed lines). All LEDs have been set up to the same power (40 nW), with equal maximal intensity values in the Arduino code (c.f. 6.3). b. as a. but with LEDs set up at different maximal intensities in the Arduino code. Here the linearity of the LED intensity output remains constant. |

Potentiometer Mount PCB. Wiring example of the LED channel 1 to its trimmer potentiometer. Note that LED polarity as indicated on the stimulator PCB must be respected. |

Stimulator box. a. Rendering of the stimulator box 3D files set here by default for 4 LED channels and 4 proxy LEDs. b. Rendering of the fully mounted stimulator with all PCBs and components tightly fitting their respective space. |

3D-printed Illumination systems. a. SCAD files for adapting 5 mm LEDs and dichroic mirrors to standard 30 mm optomechanical system. b. Rendering of the LED illumination system for the visual experiment. c. For optogenetics experiments, we designed a mounting platform that holds four 5 mm LEDs and can fit a RC-40HP chamber (SmartEphys, Warner Instrument). d. Same as c. but designed to fit a small petri dish (ø 35 mm) lid. |

Stimulus example. LED sequence (On/Off steps of light over three loops) described above, along with trigger recording. |
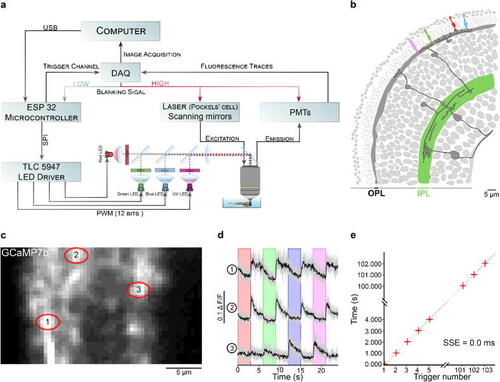
Zebrafish retina experiment. a. Overview of the setup described for the visual stimulation experiment performed on the tetrachromatic zebrafish. b. Drawing of the larval zebrafish retina highlighting the IPL. c. 2 photon scan field of the IPL with regions-of-interest marked by red circles. The 64x32 pixel image was obtained by at 1 ms scan rate. d. Ca2+ traces (mean traces in black, n = 5 trials in grey) in response to consecutive red, green, blue and UV On/Off flashes. e. Trigger timing recorded by the DAQ highlighting its accuracy over time with a precision of 0.1 µs. t(n + 1) = t(n) + T, where “t” is the recorded trigger time and “T” the trigger period. |

Drosophila optogenetics experiment. a. Schematic of a fruit fly first instar larval head expressing the red-shifted channel rhodopsin CsChrimson in olfactory sensory neurons and GCaMP6s in pan-neuronally. b. Rendering of the experimental setup: The mounting chamber ( |