
- Title
-
Mapping Molecular Networks within Clitoria ternatea Linn. against LPS-Induced Neuroinflammation in Microglial Cells, with Molecular Docking and In Vivo Toxicity Assessment in Zebrafish
- Authors
- Mat Zian, N.F.A., Swain, P., Mohd Faudzi, S.M., Zakaria, N., Wan Ibrahim, W.N., Abu Bakar, N., Shaari, K., Stanslas, J., Choi, T.I., Kim, C.H.
- Source
- Full text @ Pharmaceuticals (Basel)
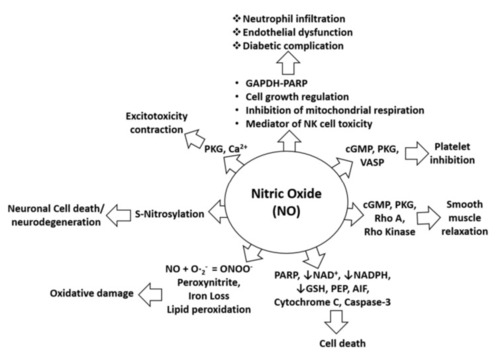
Figure 1. NO in pathophysiological conditions. NO-mediated activation of cGMP, PKG, and VASP can cause platelet inhibition, whereas NO-mediated induction of pro-apoptotic proteins (PARP, AIF, cytochrome C, and cleaved caspase-3) can induce cell death. Furthermore, NO-mediated activation of cGMP, PKG, Rho A, and Rho kinase can alter smooth muscle relaxation, whereas inhibition of NAD, NADPH, and GSH by NO increases cell death. Moreover, lipid peroxidation caused by NO leads to oxidative stress or damage, and S-nitrosylation induced by NO may lead to neurotoxicity or neurodegeneration. In addition, NO-mediated induction of PKG and calcium signaling leads to excitotoxicity and contraction effects. NO is also involved in neutrophil infiltration and endothelial dysfunction through effects on mitochondrial respiration, NK cell toxicity, and activation of the GAPDH-PARP pathway and its functions [26].
|

Figure 2. Cytotoxic effect of different parts of C. ternatea extracts (CTR, CTF, and CTL) on viability of (A) BV-2 microglial and (B) human neuroblastoma SK-N- SH cells after 24 h. Percentage cell viability is expressed as mean ± SD of three independent experiments. The value is statistically significant **** (p < 0.0001) compared to the untreated cells; ns means not significant.
|

Figure 3. Effect of CTR, CTL, and CTF extracts on NO production in LPS-induced BV-2 cells for 24 h. The NO level is denoted as mean values ± SD, and n = 3. The extract showed dose-dependent inhibition of NO release. The value is statistically significant * (p < 0.05), ** (p < 0.01), and *** (p < 0.001) when compared with LPS alone.
|

Figure 4. Cytotoxic effect of CTF fractions on viability of (A) BV-2 microglial and (B) human neuroblastoma SK-N-SH cells after 24 h. Percent cell viability is expressed as mean ± SD of three independent experiments. The value is statistically significant ** (p < 0.01), *** (p < 0.001), and **** (p < 0.0001) compared to the untreated cells; ns means not significant.
|

Effect of ( |

Figure 6. Total ion chromatograms (TICs) of the ethyl acetate fraction of flower methanolic extract of C. ternatea (CTF_EA) in (A) positive mode, (B) negative mode, and (C) negative modes in between 3rd to 10th minutes. The number above each peak represents peak numbers, corresponding to the peak numbers in Table 1.
|

Figure 7. Full visualization of the molecular network in negative ion mode of the flower extract (CTF) and ethyl acetate fraction (CTF_EA) of C. ternatea. The annotated classes of metabolites are: (A) flavonol 3-O-glycosides, (B) hydrocinnamic acids and derivatives, (C) glycerophospholipid, (D) amino acids, (E) carbohydrates, (F) mono-methoxylflavonol 3-O-glycoside and (G) saccharolipid.
|

Figure 8. Flavonol 3-O-glycoside (cluster A in negative mode) from the full molecular network (MN) of ethyl acetate fraction of flower C. ternatea (CTF_EA) extract. The metabolites in red boxes were annotated based on the GNPS library matching.
|

Figure 9. Proposed fragmentation mechanism of (A) kaempferol 3-O-glycoside and (B) quercetin 3-O-glycoside in negative ion mode.
|

Figure 9. Proposed fragmentation mechanism of (A) kaempferol 3-O-glycoside and (B) quercetin 3-O-glycoside in negative ion mode.
|

Figure 10. Hydrocinnamic acids and derivatives (cluster B in negative mode) from the full molecular network (MN) of ethyl acetate fraction of flower C. ternatea (CTF_EA) extract. The metabolites in red boxes were annotated based on the GNPS library matching.
|

Figure 11. Fragmentation pathway for (A) coumaroyl, (B) caffeoyl, and (C) feruloyl derivatives.
|
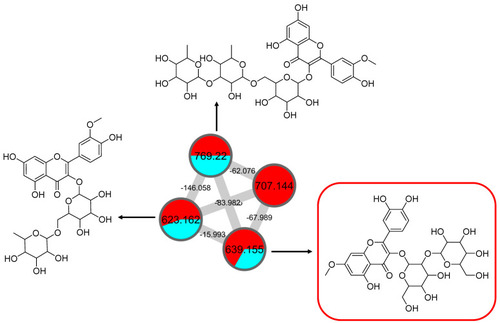
Figure 12. Mono-methoxyl flavonol 3-O-glycosides (cluster F in negative mode) from the full molecular network (MN) of ethyl acetate fraction of flower C. ternatea (CTF_EA) extract. The metabolites in the red box were annotated based on GNPS library matching.
|

Figure 13. Proposed fragmentation mechanism in the MS/MS spectra recorded for the (A) mono-methoxyl group in negative ion mode of (B) isorhamnetin and (C) rhamnetin.
|
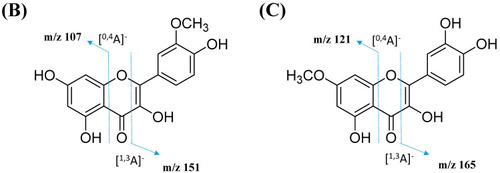
Figure 13. Proposed fragmentation mechanism in the MS/MS spectra recorded for the (A) mono-methoxyl group in negative ion mode of (B) isorhamnetin and (C) rhamnetin.
|
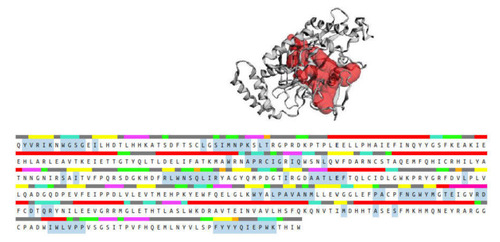
Figure 14. Binding pocket (red color) from the CASTp 3.0 tool, along with the sequence showing the residues highlighted in blue that form the binding pocket.
|

Binding interactions of major active metabolites |

Figure 16. Morphological characteristics of zebrafish larvae at different developmental stages of (A) 24 hpf, (B) 24 hpf (dechorionated zebrafish), (C) 48 hpf, and (D) 72 hpf with CTF_EA fraction at concentrations of 200 µg/mL, 100 µg/mL, and 50 µg/mL. The changes in body size, yolk expansion, somite boundary, and pigment cell development, as well as heart rate and blood circulation (data not shown), were observed and measured. Scale bar, 200 µm.
|

Figure 17. Tail-coiling rate in zebrafish embryos exposed to CTF_EA at different concentrations (200 µg/mL, 100 µg/mL, 50 µg/mL, 25 µg/mL, and 12.5 µg/mL) at 24 hpf developmental stage. Each dot represents the number of spontaneous tail coils per individual animal (n = 10 for each concentration). Mean values were expressed as bar graphs; ns means not significant.
|

Figure 18. Effects of CTF_EA at different concentrations of 100 µg/mL, 50 µg/mL, and 25 µg/mL on blood vessel development in transgenic zebrafish, Tg(kdrl:egfp) at 30 hpf. Vasculogenesis and angiogenesis in the trunk region were normal in both control and CTF_EA-treated zebrafish. Scale bar, 200 µm.
|

Figure 19. Visualization of apoptosis on CTF_EA-treated zebrafish larvae at different concentrations of 100 μg/mL, 50 μg/mL, and 25 μg/mL, respectively, using the vital fluorescent acridine orange staining. Signals in yolk and lens are autofluorescence. Scale bar, 200 µm.
|