
Image
|
Figure Caption
Figure 6
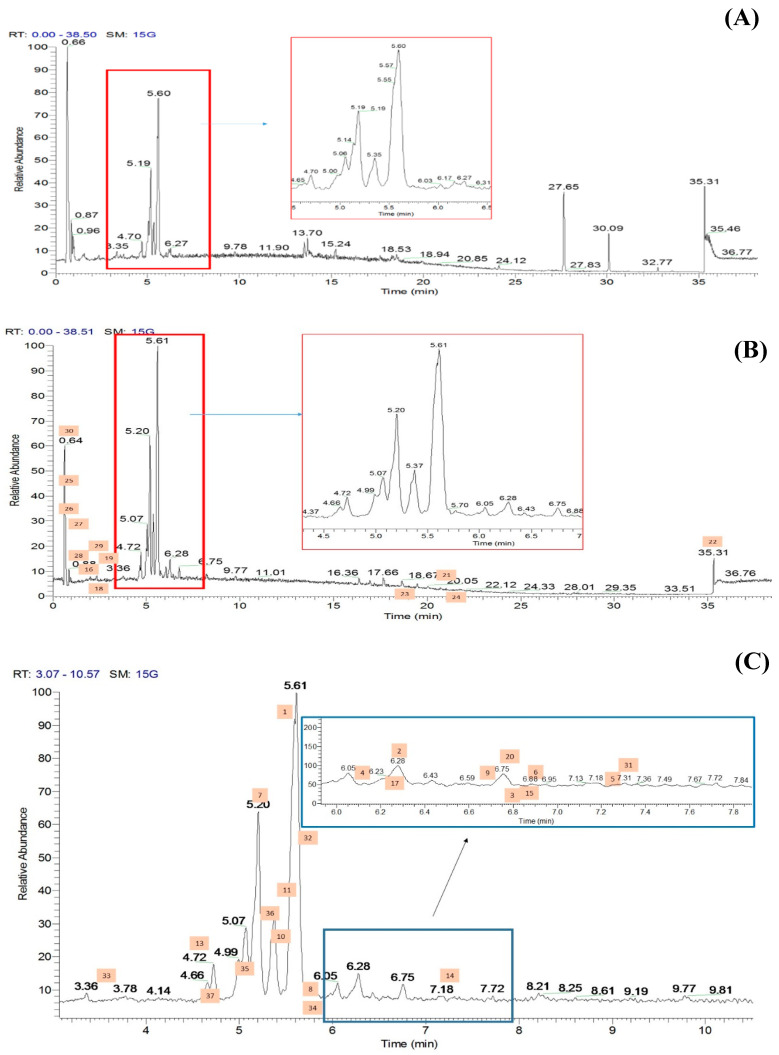
Figure 6. Total ion chromatograms (TICs) of the ethyl acetate fraction of flower methanolic extract of C. ternatea (CTF_EA) in (A) positive mode, (B) negative mode, and (C) negative modes in between 3rd to 10th minutes. The number above each peak represents peak numbers, corresponding to the peak numbers in Table 1.
Acknowledgments
This image is the copyrighted work of the attributed author or publisher, and
ZFIN has permission only to display this image to its users.
Additional permissions should be obtained from the applicable author or publisher of the image.
Full text @ Pharmaceuticals (Basel)