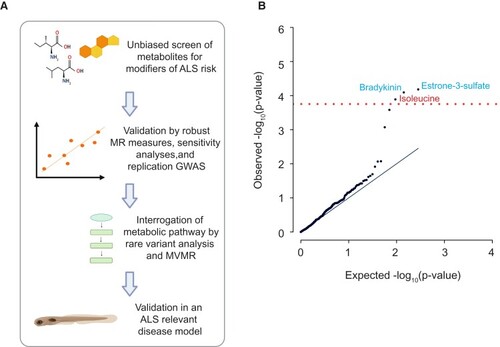
Unbiased screen for metabolites linked to ALS risk. (A) Schematic of the study design: We performed an unbiased screen of 566 metabolites using Mendelian randomization (MR) to infer a causal relationship with ALS. Metabolites that passed stringent multiple testing correction were further evaluated using robust MR measures, sensitivity analyses and a validation GWAS. Next, for metabolites that passed all measures, we evaluated other members of their metabolic pathway using orthogonal techniques which utilize common and rare genetic variants so as to infer the underlying biological mechanism. Finally, we evaluated proposed mechanisms of neurotoxicity/neuroprotection in an ALS-relevant disease model. MVMR refers to multivariable Mendelian randomization in which multiple exposures are considered simultaneously. (B) QQ-plot demonstrates that there was no evidence of P-value inflation in our unbiased screen (λ = 1.11); three metabolites were significant after Bonferroni’s multiple testing correction (red line). Blue text denotes a protective association, whereas red text denotes a harmful association.
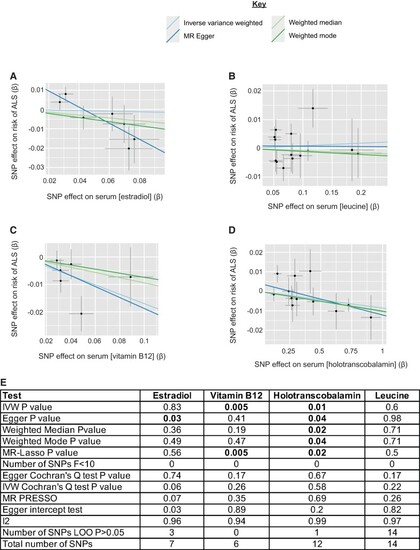
MR analysis of additional members of metabolic pathways containing metabolites identified in an unbiased screen. (A–D) Scatter plots demonstrating the correlation between genetic liability to serum estradiol (MR Egger P = 0.03, beta = −0.42, se = 0.14) (A), leucine (IVW P = 0.6, beta = 0.009, se = 0.017) (B), vitamin B12 (IVW P = 0.005, beta = −0.17, se = 0.06) (C), and holotranscobalamin (IVW P = 0.01, beta=-0.08, se = 0.004) (D), with genetic liability to ALS. Points indicate effect size (β) and standard errors for each SNP-outcome relationship. (E) Robust MR measures and sensitivity analyses for each MR analysis.
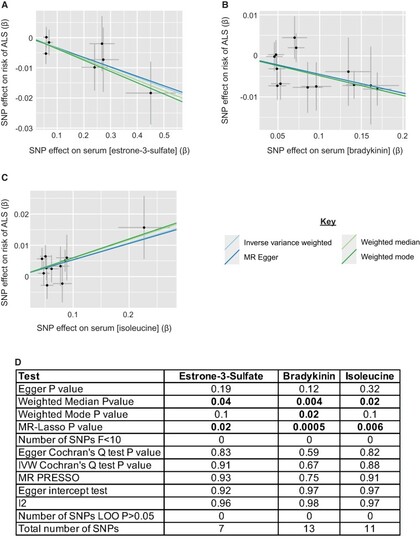
Metabolites identified in an unbiased screen are significant in multiple robust MR measures. (A–C) Scatter plots demonstrating the correlation between genetic liability to serum estrone-3-sulphate (IVW P = 6.58e−05, beta = −0.03, se = 0.008) (A), bradykinin (IVW P = 8.07e-05, beta = −0.05, se = 0.01) (B), and isoleucine (IVW P = 1.29e−04, beta = 0.05, se = 0.01) (C), with genetic liability to ALS. Points indicate effect size (β) and standard errors for each SNP-outcome relationship. (D) Robust MR measures and sensitivity analyses for each MR analysis.
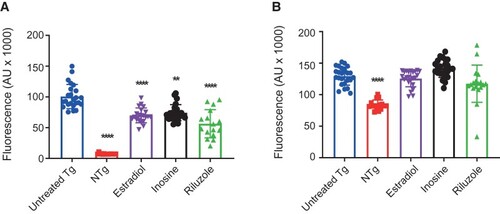
Application of estradiol to a zebrafish model of C9ORF72-ALS reduces cellular stress. (A) The effect of 3 days of metabolic supplementation on zebrafish DsRed expression with 10µM estradiol (30.4% reduction in DsRed expression, Kruskal Wallis H-test with Dunn’s multiple testing correction P = 0.0003), 30 mM inosine (26.1% reduction, P = 0.0024) or 10 µM riluzole (43.9% reduction, P < 0.0001). (B) The effect of metabolic supplementation on zebrafish GFP expression; no significant changes were observed. Untreated Tg indicates transgenic fish treated with 0.1% DMSO vehicle control. NTg indicates non-transgenic fish. Data presented as mean with standard deviation from two independent clutches of fish. ** P≤0.01. ****P≤0.001.
This image is the copyrighted work of the attributed author or publisher, and
ZFIN has permission only to display this image to its users.
Additional permissions should be obtained from the applicable author or publisher of the image.
Full text @ Brain Commun
Your Input Welcome
Thank you for submitting comments. Your input has been emailed to ZFIN curators who may contact you if
additional information is required.
Oops. Something went wrong. Please try again later.